Extended Data Figure 1.
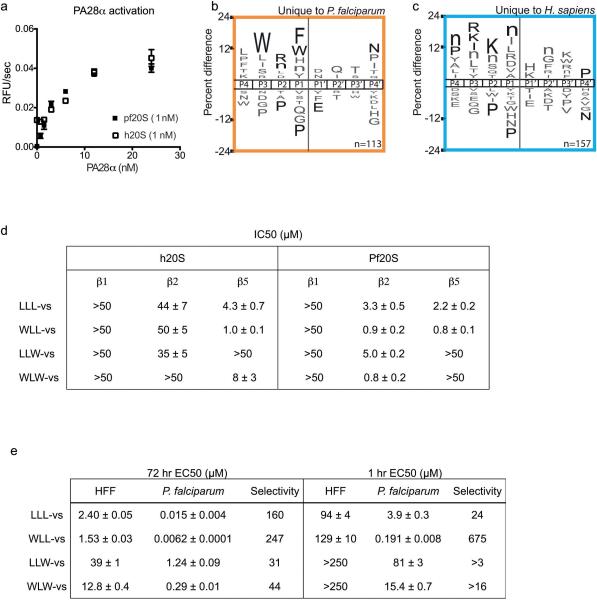
(a-c) Substrate cleavage profile of activated human and P. falciparum 20S proteasome. a, Activation of the human and P. falciparum 20S proteasome by human PA28α. Activity was determined by cleavage of the fluorogenic substrate Suc-LLVY-amc. Error bars represent s.d. and n=3 purified proteasome in technical replicates. b and c, iceLogos of cleavage sequences that are uniquely processed by either the P. falciparum (b) or human proteasome (c). Amino acids that are most and least favored at each position are shown above and below the axis, respectively. Lowercase ‘n’ corresponds to norleucine and amino acids in black text are statistically significant (p < 0.05, unpaired two-tailed Student's t-test). (d-e) Inhibition potencies of the vinyl sulfone inhibitors. d, Table of IC50 values for each inhibitor in 1 hr P. falciparum and human 20S proteasome. IC50 values are determined from 3 independent experiments of inhibitor pretreatment followed by activity labeling of the 20S proteasome (n=3 purified proteasome). Gels in Fig. 1f and Extended Data Figure 2b were quantified to calculate the IC50 values (for gel source data and replicates, see Supplementary Fig. 1 a-b). Data is mean ± s.d. e, Table of EC50 values for each of the inhibitors in 1 hr and 72 hr treatment of P.falciparum at ring stage or non-confluent human foreskin fibroblasts (HFF). Data is mean ± s.d. n=6 parasite cultures from 2 independent experiment of triplicates for P. falciparum treatments. n=9 cell cultures from 3 independent experiments of triplicates for HFF treatment, except for 1hr WLW-vs, 1hr LLW-vs and 72 hr LLL-vs, where n=6 cell cultures from 2 independent experiment of triplicates.

