Fig. 2.

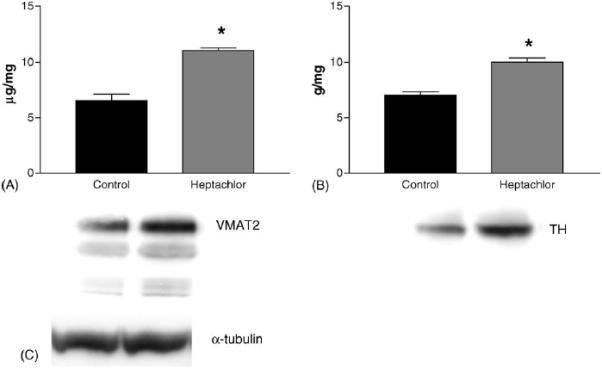
Striatal VMAT2 (A), and TH (B) levels as measured by Western immunoblotting in the offspring of mice exposed to 3 mg/kg heptachlor throughout gestation and lactation. Representative Western blots of VMAT2 and TH are represented below each graph. (C) Representative Western blot of α-tubulin to ensure equal protein loading. Data represent mean ± S.E.M. (n = 3–4 animals per treatment group). (*) Indicates that the groups are significantly different from each other (p ≤ 0.05) by Student's t-test.
