Figure 1.
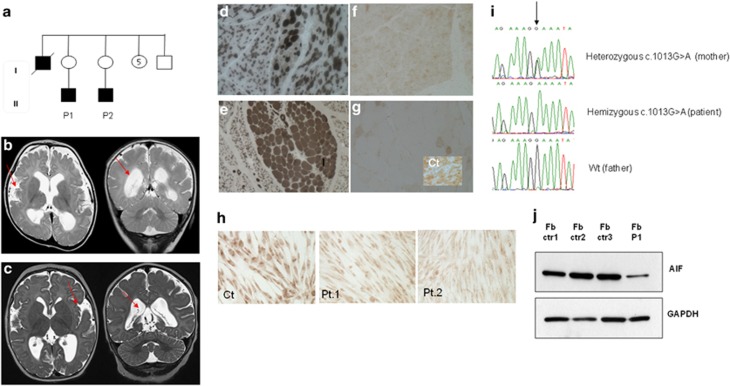
(a)The family tree shows the probands in the second line, and seven sisters and two brothers (one deceased) in the first line. (b and c) MRI in P1 and P2. The T2-weight axial and coronal images show frontotemporal atrophy (left arrow) and widening of subarachnoid spaces of the lateral ventricles (right arrow). (d–g) Morphological analysis of muscle biopsies from P1 (upper images) and P2 (lower images). The ATP-ase staining (left side of the panel) shows neurogenic features, whereas the cytochrome c oxidase staining (right side) shows a decrease in the histochemical reaction in both patients. Inset shows the reaction in an age-matched control biopsy. (h) The cytochrome c oxidase staining shows a decreased reaction in both patients' fibroblasts compared with a control line (left side). (i) The electropherogram of AIFM1 in P1 and his mother, compared with a wild-type sequence. The arrow indicates the position of the nucleotide change identified in our patients. (j) Western blot analysis in controls and patient's fibroblasts using AIF and GAPDH antibodies: the patient's sample shows a clear reduction in the AIF amount compared with the control lines.

