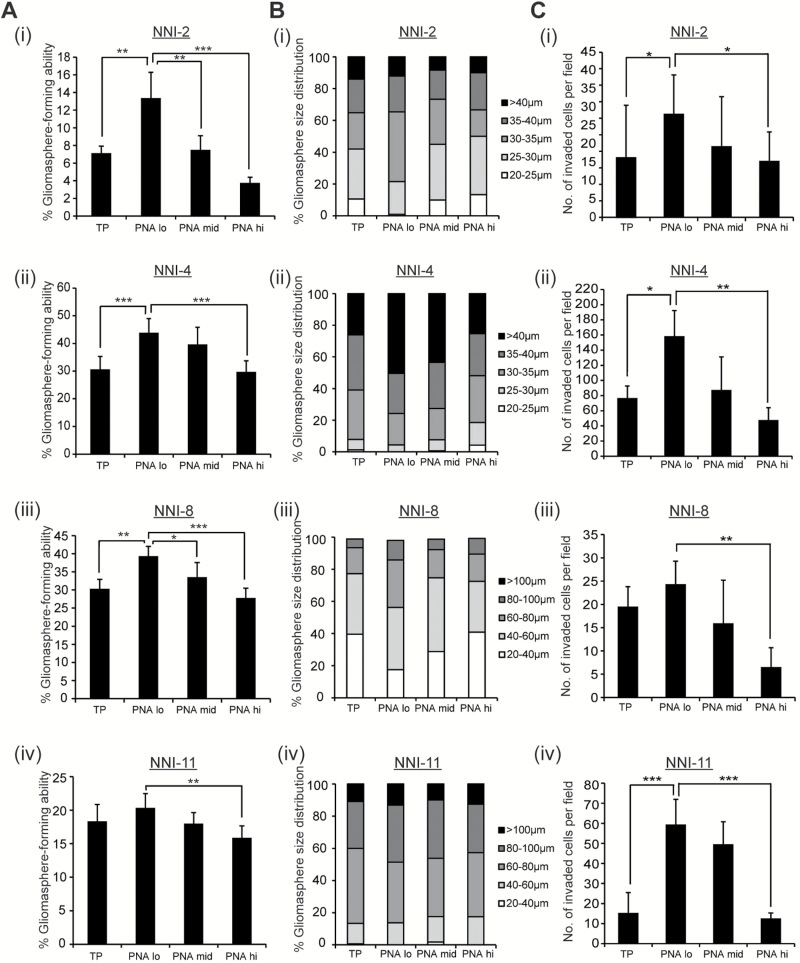
Figure 1.
PNA expression in glioma-propagating cells (GPCs). A, i-iv) Gliomasphere-forming frequency was evaluated in total unsorted population (TP) and PNA-sorted, patient-derived GPCs (NNI-2, 4, 8, and 11). B, i-iv) Gliomasphere size distribution was measured in TP and PNA-sorted cells (NNI-2, 4, 8, and 11). C, i-iv) Invasive capacity was determined in TP and PNA-sorted GPCs (NNI-2, 4, 8, and 11). *P < .05; **P < .01; ***P < .001. For statistical analysis, two-sided Student’s t test was used. GPCs = glioma-propagating cells.

