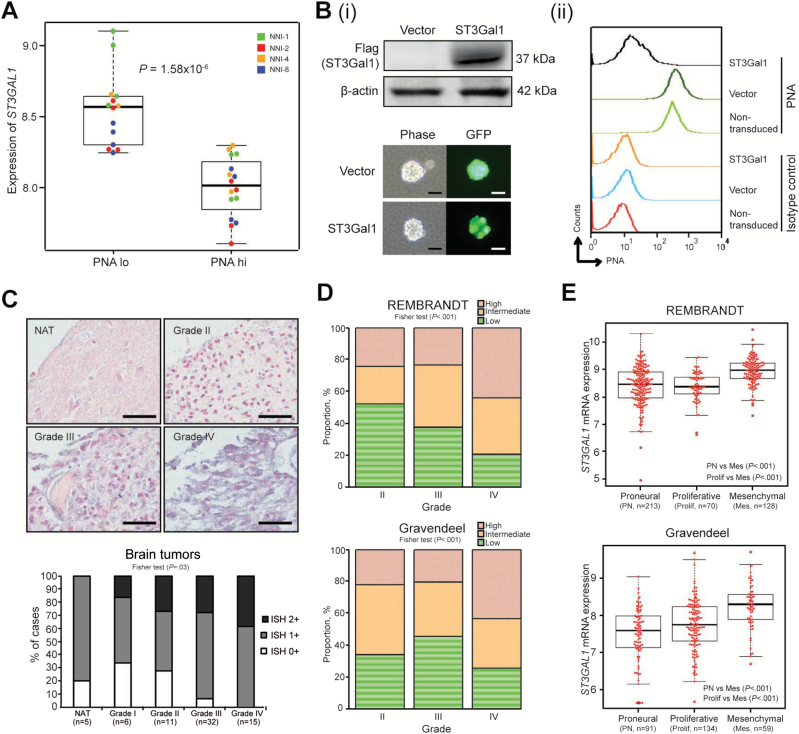
Figure 2.
ST3Gal1 expression in high-grade gliomas. A) ST3GAL1 mRNA expression was determined in flow-sorted PNA-lo and -hi expression groups of four glioma-propagating cells (GPCs): NNI-1, 2, 4, and 8; P = 1.58x10⁻⁶. B, i) Upper panel, flag-tagged ST3Gal1 protein was overexpressed in NNI-8 GPCs; lower panel, underwent puromycin selection. Efficient lentiviral transduction efficiency was visualized through the green fluorescent protein (GFP) tag incorporated in the vectors. Scale bar denotes 50 μm; (ii) flow histograms representing PNA fluorescence with controls defined in figure. C) Upper panel, ST3GAL1 mRNA expression was evaluated by in situ hybridization in five normal-adjacent cerebral tissue (NAT) specimens and 64 glioma specimens from grades I-IV. Representative images are shown. Lower panel, staining intensity was quantified as ISH0+, ISH1+, and ISH2+, in order of increasing positive signal. Fisher test P = .04. Scale bar denotes 50 μm. D) ST3GAL1 mRNA expression was evaluated in two independent clinical glioma databases, REMBRANDT and Gravendeel (Fisher test P values, REMBRANDT P < .001; Gravendeel P < .001). E) ST3GAL1 mRNA expression was determined in molecular subclasses of REMBRANDT and Gravendeel databases. P values are indicated in the figures. For statistical analysis, two-sided Student’s t test was used. GPCs = glioma-propagating cells; PNA = Peanut Agglutinin.

