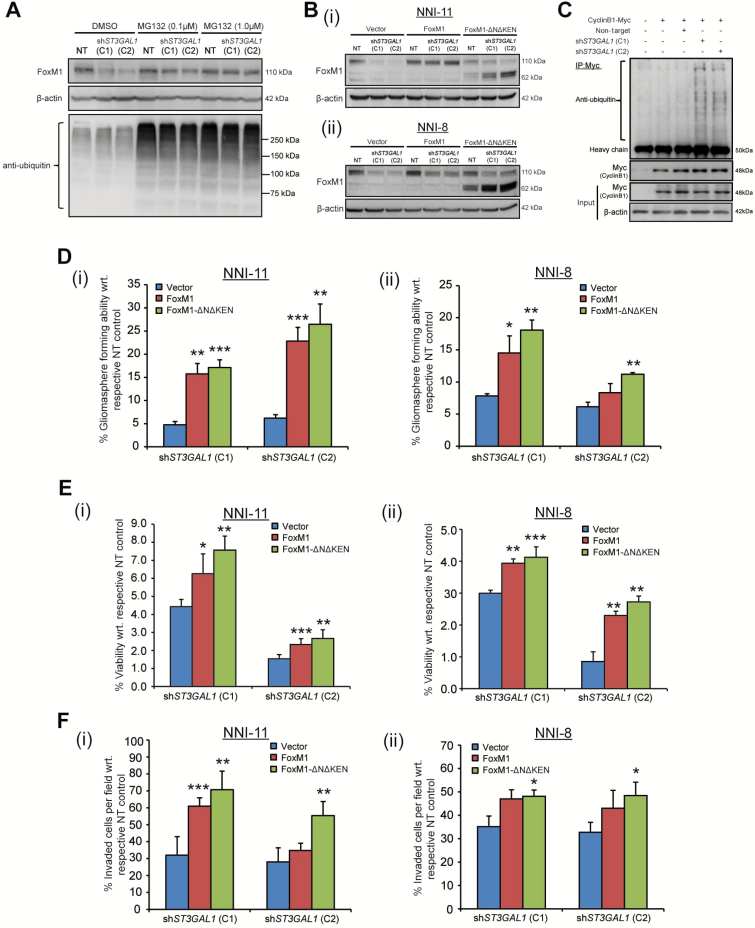
Figure 5.
Role of FoxM1 in ST3Gal1 signaling. A) FoxM1 protein levels were assessed upon ST3GAL1 knockdown in NNI-11 glioma-propagating cells (GPCs) or in the presence of increasing concentrations (0.1 and 1 μM) of MG132, a proteasome inhibitor. Extent of ubiquitination was also assessed. B, i) NNI-11 and (ii) NNI-8 GPCs were lentivirally transduced with vector control, FOXM1 or FOXM1-ΔNΔKEN overexpression constructs, followed by ST3GAL1 knockdown (C1 and C2) or NT control. FoxM1 protein levels were evaluated and compared with β-actin loading control. C) APC/C-Cdh1 activity was determined in cells transduced with NT or shST3GAL1 (C1 and C2) vectors. Cyclin B1 (Myc-tagged) was immunoprecipitated, and the extent of ubiquitination assessed. D) Ability of FOXM1 and FOXM1-ΔNΔKEN overexpression constructs to rescue gliomasphere formation after ST3GAL1 knockdown in (i) NNI-11 and (ii) NNI-8 GPCs was evaluated. *P < .05; **P < .01; ***P < .001; vs NT control. E) Ability of FOXM1 and FOXM1-ΔNΔKEN overexpression constructs to rescue viability after ST3GAL1 knockdown in (i) NNI-11 and (ii) NNI-8 GPCs was evaluated. *P < .05; **P < .01; ***P < .001; vs NT control. F) Ability of FOXM1 and FOXM1-ΔNΔKEN overexpression constructs to rescue invasive potential after ST3GAL1 knockdown in (i) NNI-11 and (ii) NNI-8 GPCs was evaluated. *P < .05; **P < .01; ***P < .001; vs NT control. For statistical analysis, the one-sided Student’s t test was used, where the assumption was made in advance that the results would only be in one direction (one-sided). This assumption was proven correct by the data. C1 and C2 represent 2 independent ST3GAL1 knockdown clones. APC/C-Cdh1 = anaphase-promoting complex/cyclosome-Cdh1; GPCs = glioma-propagating cells; NT = nontargeting.

