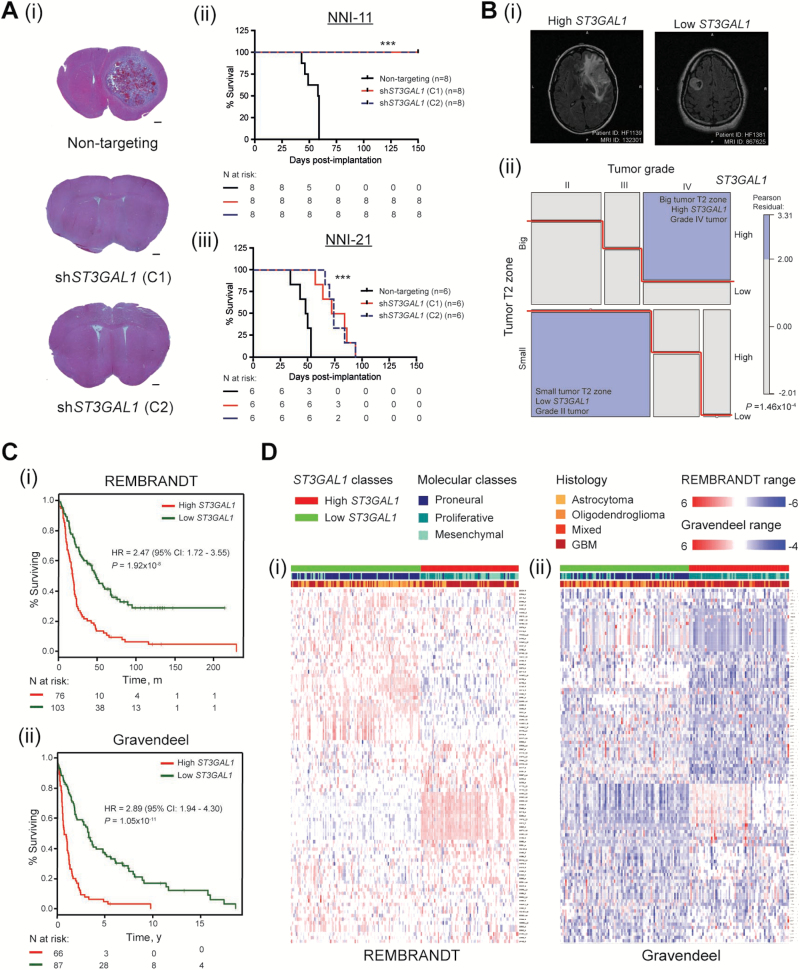
Figure 6.
Role of ST3Gal1 in orthotopic mouse xenograft model and patient prognosis. A) NOD-SCID gamma (NSG) mice were intracranially implanted with NNI-11 (mesenchymal) and NNI-21 (proneural) glioma-propagating cells (GPCs) transduced with nontargeting or two independent shST3GAL1 clones, C1 and C2. A, i) Representative coronal sections of NNI-11 mice brains are shown (n = 3 shown in figure). Scale bar denotes 500 μm. Kaplan-Meier survival plots of animal groups implanted with (ii) NNI-11 (groups of 8 in 3 arms: nontargeting, C1, and C2) and (iii) NNI-21 (groups of 6 in 3 arms: nontargeting, C1, and C2) are shown. ***P < .001. B) Interaction of ST3GAL1 status with tumor grade and T2 volume was determined. A three-way contingency analysis was performed using the log-linear model. A graphical representation was constructed using a mosaic plot to illustrate the interactions between these categorical variables. Mosaic plots were generated using R statistical packages called “vcd” and “vcdExtra”. High ST3GAL1 represents the patient cohort with upregulated ST3GAL1-associated gene signature, and vice versa. B, i) Representative magnetic resonance scans and (ii) dark purple boxes represent enriched interaction criteria; P = 1.46x10⁻⁴. C) The ST3GAL1-associated gene signature stratifies survival in (i) REMBRANDT (hazard ratio [HR] = 2.47, 95% confidence interval [CI] = 1.72 to 3.55, P = 1.92x10⁻⁸) and (ii) Gravendeel (HR = 2.89, 95% CI = 1.94 to 4.30, P = 1.05x10⁻¹¹) clinical glioma databases. D) High and low ST3GAL1 patient cohorts were analyzed for the primary tumor molecular classification scheme specified by Phillips et al. (proneural, proliferative, mesenchymal) and histologies (astrocytoma, oligodendroglioma, mixed, glioblastsoma multiforme) in (i) REMBRANDT and (ii) Gravendeel databases. The corresponding heatmaps of the ST3GAL1-associated gene signature candidates are shown. Numbers of patients at risk in each group at various time points are indicated in the figure. Kaplan-Meier survival curves were analyzed using the log-rank test with R survival package. GPCs = glioma-propagating cells; MR = magnetic resonance; NOD-SCID = nonobese diabetic/severe combined immunodeficiency; NSG = NOD-SCID gamma.

