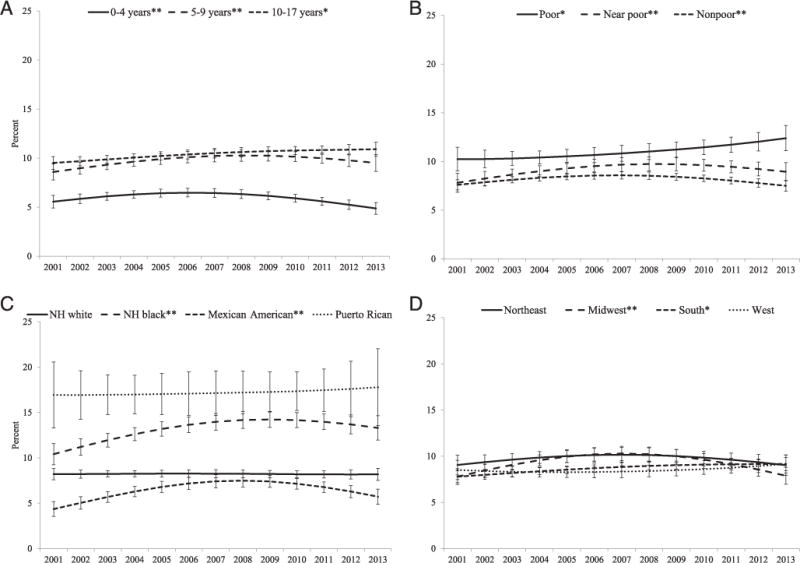
FIGURE 3.

Adjusted predicted margins of current asthma prevalence among 0- to 17-year-olds by age group (A), poverty status (B), race/ethnicity (C), and geographic region (D): United States, 2001–2013. Predicted margins are adjusted for gender, age group, poverty status, race/ethnicity, family structure, urbanicity, geographic region of residence, and 4 interactions (between time [linear and quadratic time in years] and each of 4 groups: age group, poverty status, race/ethnicity, and geographic region). *Significant linear trend by orthogonal polynomial contrast F test, P < .05. **Significant quadratic trend by orthogonal polynomial contrast F test, P < .05. Source: CDC/NCHS, NHIS. NH, non-Hispanic.
