
Figure 2.
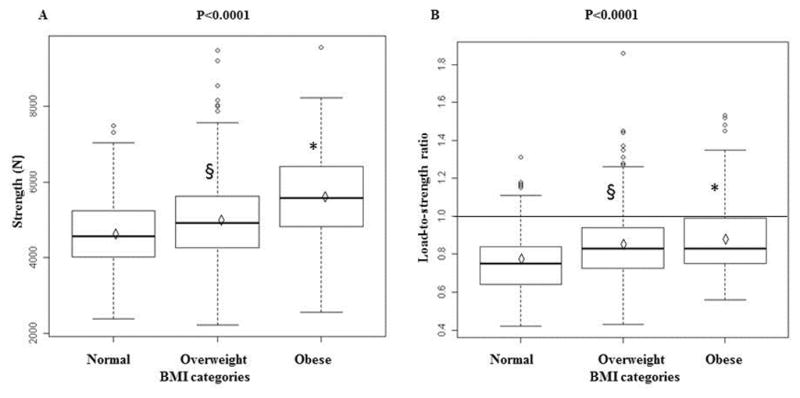
BMI and FE-derived biomechanical measurements (A) Strength (B) Load-to-strength ratio, adjusted for age, site, race and physical activity in the men of the MrOS study. P is for trend test. § P< 0.05 and * P <0.0001 compared with normal-weight men.
Sample size: N for normal weight=202; N for overweight=380; N for obese=90
The length of the box represents the interquartile range (the distance between the 25th and 75th percentiles). The symbol in the box interior represents the group mean. The horizontal line in the box interior represents the group median. The whiskers on the boxes depict the extreme values.