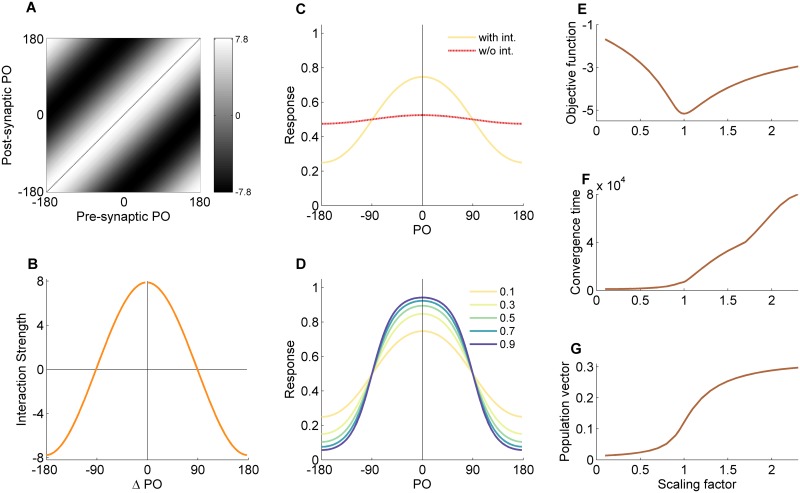
Fig 2. Behavior of the simplified hypercolumn model in the limit of low input contrast.
Results of the toy model following gradient-descent learning that minimizes the objective function at a mean contrast of 〈r〉 = 0.1. (A) The optimal interaction matrix representing the strength of recurrent connections with gray level value (interaction from neuron j onto neuron i as grey level of the pixel in the i’th row and j’th column). (B) The interaction profile for the neuron tuned to 180° (the middle column of the interaction matrix). (C) Network response in presence and absence of recurrent interactions, for an input with contrast of r = 0.1. The dashed line is the response of the network without the recurrent interactions and the solid line is the response with them. (D) The network’s response amplification to inputs at different levels of contrast. (E-G) The effect of scaling the recurrent interactions on several metrics of network behavior. (E) Objective function. (F) Convergence time of the recurrent network. (G) Magnitude of the population vector of the network response. PO—preferred orientation.

