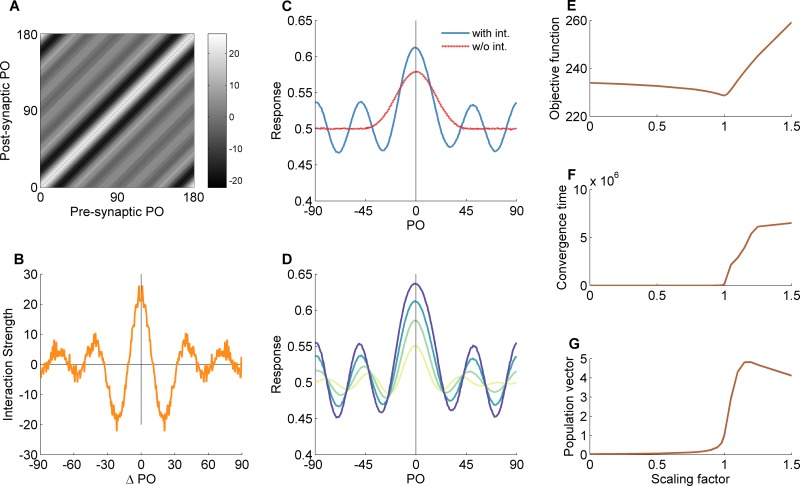
Fig 4. Behavior of the ecological hypercolumn model after training with natural scenes.
The figure is organized similarly to Fig 2. (A) Interaction matrix. (B) Interaction profile. (C) Network response with and without recurrent interactions to an oriented stimulus (a Gabor filter with similar properties to the preset feedforward filter). (D) Response amplification at different contrast levels. (E-G) Objective function (E), convergence time (F) and magnitude of the population vector (G) as a function of the scale of the recurrent interactions. Notably, the evolved network dynamics when exposed to natural images resembles more closely the behavior of the toy model after training with low contrast stimuli. PO—preferred orientation.

