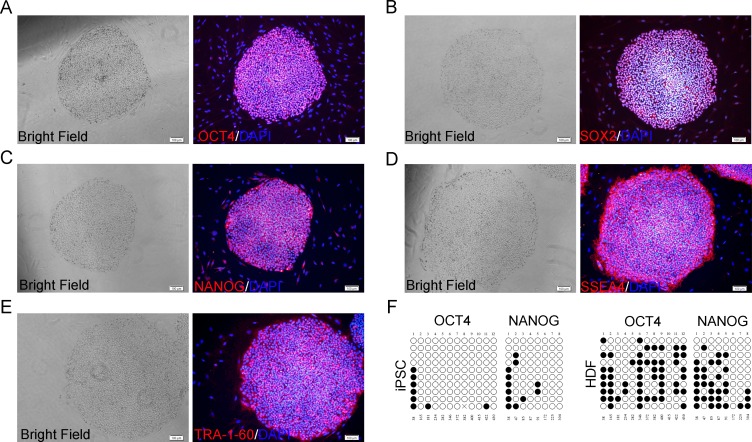
Fig 5. Expression of pluripotent markers and bisulphite sequencing analysis in hiPSCs on hUC-MSCs feeder.
Immunocytochemistry staining showed expression of a panel of pluripotent markers including OCT4 (A), SOX2 (B), NANOG (C), SSEA4 (D) and TRA-1-60 (E). Scale bar: 100 μm. (F) Bisulphite sequencing analysis of the OCT4 and NANOG promoters in hiPSCs cocultured on hUC-MSC feeders and parental fibroblast line. White circles represented demethylated CpG dinucleotides; black circles represented methylated CpG dinucleotides. Cross represented sequencing was not achieved. The cell line is indicated to the left of each cluster.

