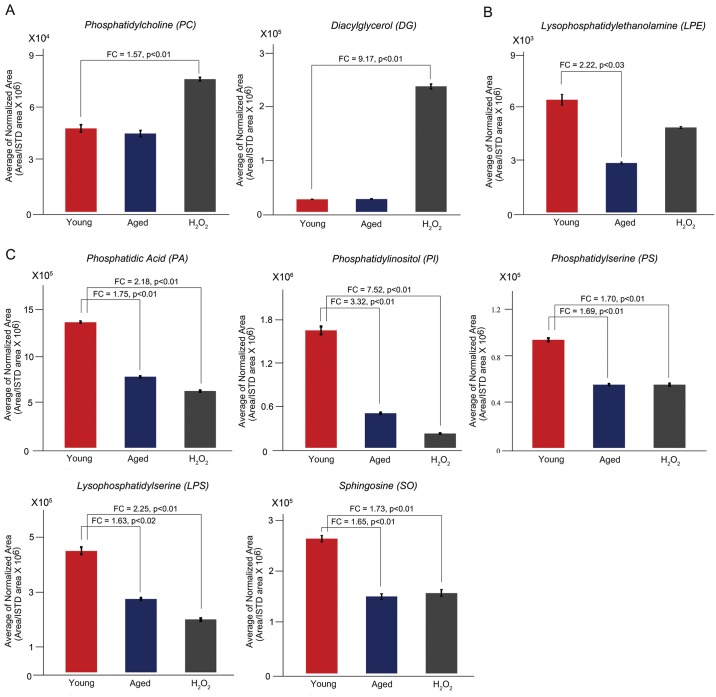
Fig 6. Lipid classes that are significantly changed between two sets of compared groups.
(A) Upregulated lipid classes and (B) downregulated lipid classes in comparison with young oocytes (control). Some of the downregulated lipid classes are similar in aged and H2O2-treated oocyte groups, but no significantly increased lipid class was identified in aged oocytes. Fold changes greater than 1.5 are shown (p < 0.05). ISTD, internal standard.

