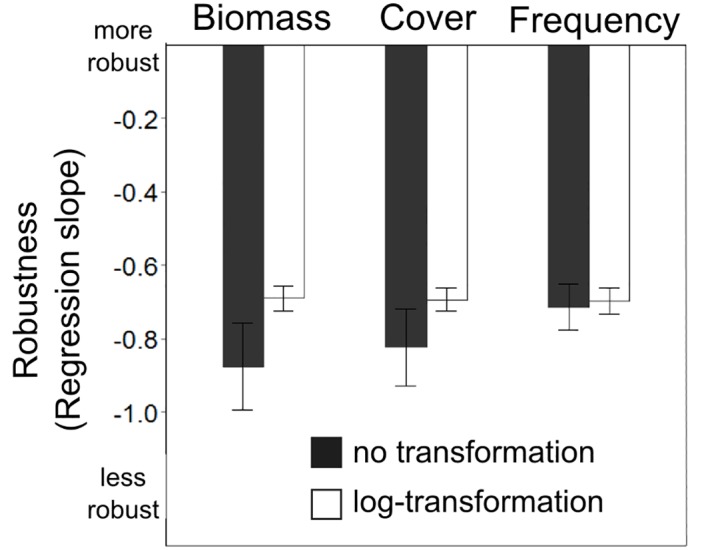
Fig 5. Effect of sampling method and abundance transformation on FD index sensitivity.

Barplot depicting the results of linear mixed effects models, specifically the interaction between abundance transformation and the different abundance measures used in plant ecology (all three abundance measures were used for the same plant dataset in order to make their effects comparable). The effect of down-weighting the dominant species by log-transformation of their abundance was most pronounced in the biomass abundance measure. When log transformed, all three sampling methods have a very similar effect on the sensitivity of indices to missing trait data. Error bars denote the 95% confidence intervals.
