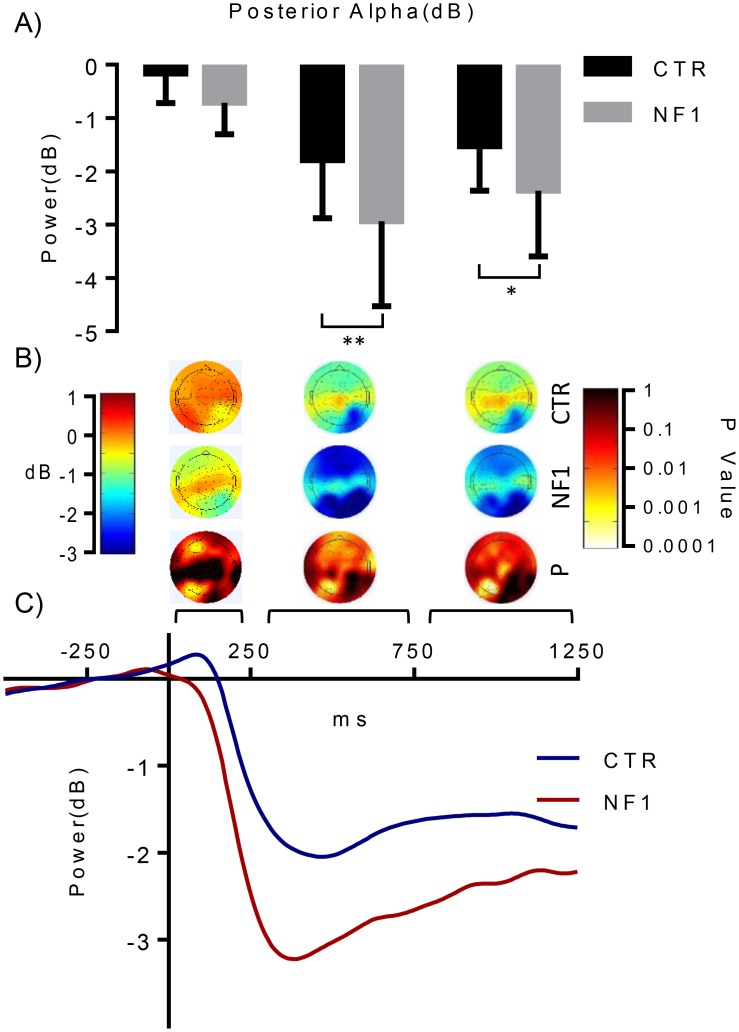
Fig 4. Time course and topography of event related alpha power.
(A) Significant differences in alpha power were found at different time periods: 250-750ms and 750-1250ms in the posterior sites between control and NF1 subjects. (B) Head topography of alpha over early (0ms-250ms), middle (250-750ms) and late (750ms-1250ms) periods (C) The time course indicates deactivation starting around 150ms, reaching a minimum power peak around 300ms. The higher level of alpha deactivation found in NF1 participants, highlights the abnormal alpha modulation in these patients.

