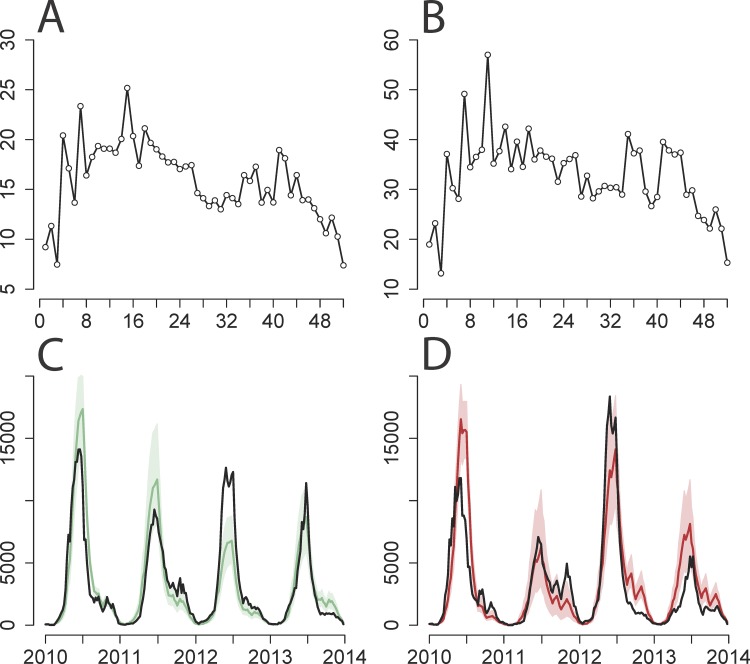
Fig 2. Two-serotype TSIR model fit for Beijing province.
(A and B) Estimated (y-axis) by week (x-axis) for (A) EV-A71 and (B) CV-A16. (C and D) Observed number of cases adjusted for reporting rate (y-axis) by week (years 2010–2013, x-axis) (black line) against predictions from 1,000 stochastic simulations of the entire time series for (C) EV-A71 and (D) CV-A16, showing median value (solid colored line) and 5th and 95th percentiles of the simulations (shaded area). Calculated with α = 0.95 and province-specific maximum likelihood estimates of cross-protection (k = 21 wk and δ = 1).

