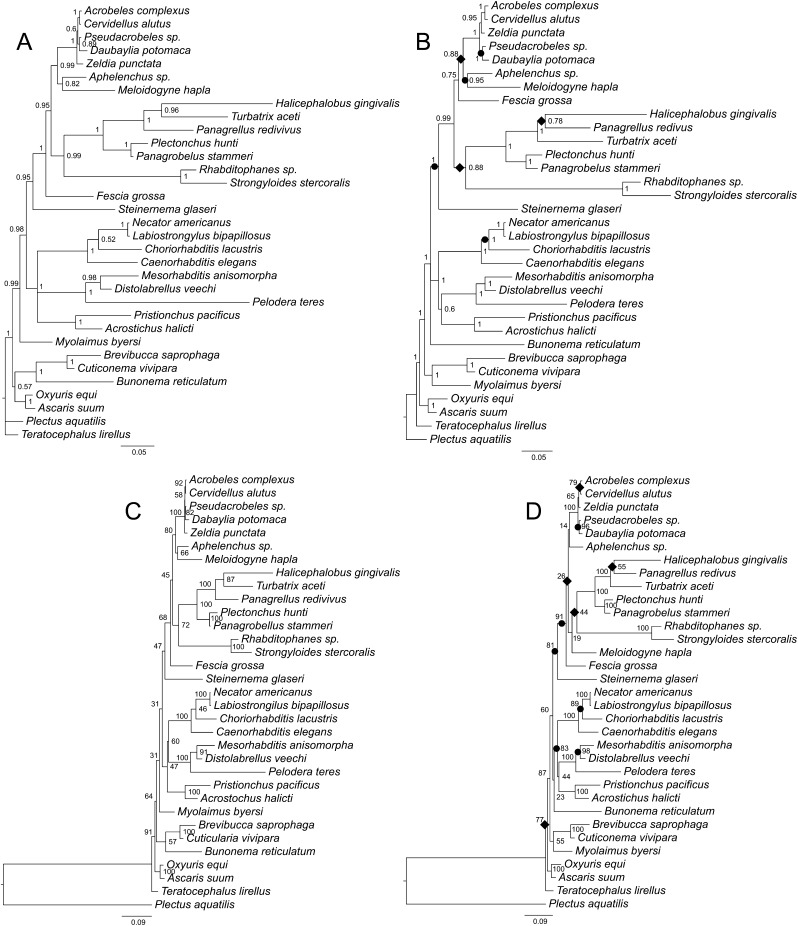
Fig. 5.
Phylogenetic trees of the relationships of Rhabditida inferred using two different ProAlign progressive posterior probability-filtered alignments. A. Bayesian consensus tree based on the 18S data. B. Bayesian consensus tree based on the combined 18S + 28S data. C. Best maximum likelihood tree based on the 18S data. D. Best maximum likelihood tree based on the combined 18S + 28S data. Bayesian posterior-probability values and maximum likelihood bootstrap values are shown at nodes where appropriate. Individual increases and decreases in support values for clades (by 0.05 or more in BPP values or by 5% or more in bootstrap values) based on comparison of the 18S + 28S results to the 18S results are marked by black circles (increase) or rhombs (decrease) on the 18S + 28S trees.

