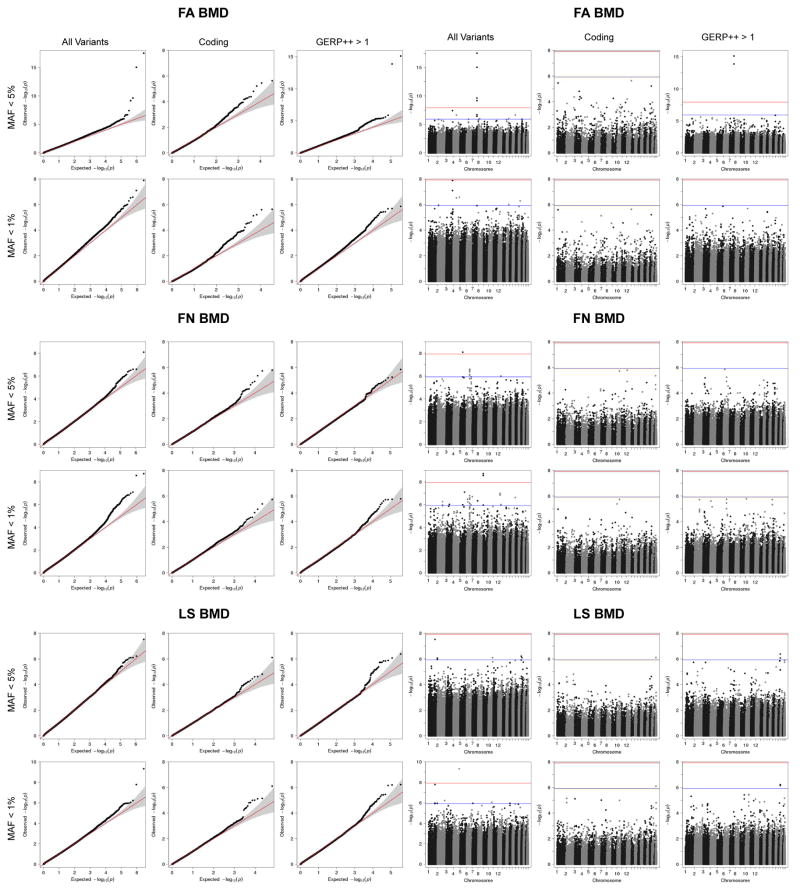
Extended Data Figure 9. Region-based association tests using skatMeta for windows of 30 SNVs and window step of 20 SNVs.
a. From top to bottom, quantile-quantile plots for forearm BMD (FA), femoral neck BMD (FN), and lumbar spine (LS) BMD. For each MAF range considered (<5% or <1%), analysis was conducted across all variants, variant overlapping coding exons, and variants with GERP++ score > 1. b. From top to bottom, Manhattan plots forearm BMD, femoral neck BMD, and lumbar spine BMD. For each MAF range considered (<5% or <1%), analysis was conducted across all variants, variant overlapping coding exons, and variants with GERP++ score > 1. Blue and red lines at genome-wide suggestive [P = 1.2 × 10⁻⁶] and genome-wide significant [P = 1.2 × 10⁻⁸] thresholds, respectively.

