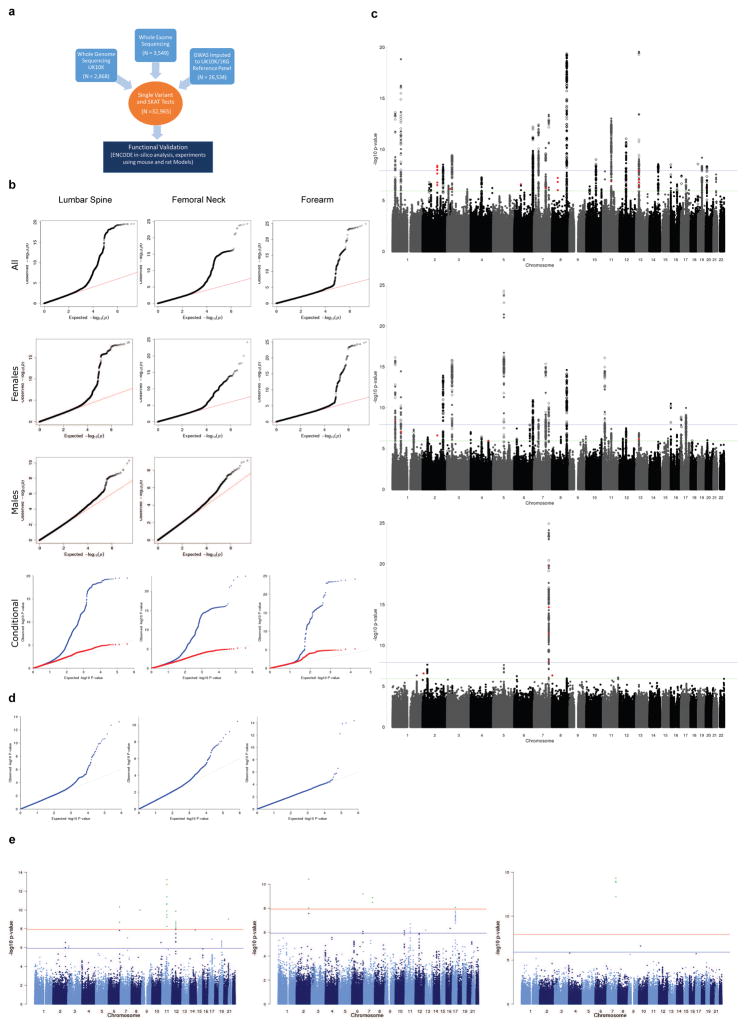
Extended Data Figure 1. Discovery single variant meta-analysis.
a. Overall study design b. From top to bottom, quantile-quantile plots for the sex-combined single SNV meta-analysis, sex-stratified single SNV meta-analysis (forearm phenotype consists solely of female-only cohorts), and sex-combined single SNV conditional meta-analysis. Plots depicts p-values prior (blue) and after conditional analysis (red). c. From top to bottom, Manhattan plots for sex-combined meta-analysis for lumbar spine BMD, femoral neck BMD, and forearm BMD. Each plot depicts variants from the UK10K/1KG reference panel with MAF > 0.5% across the 22 autosomes (odd=grey, even=black) against the –log10 p-value from the meta-analysis of 7 cohorts (dots). Also depicted is the subset variants from the reference panel that are also present in Estrada et al. (2012) with p value < 5e-6 (diamonds). Variants with MAF < 5% and p < 1.2e-6 are also depicted (red). d. Quantile-Quantile plots for the sex-combined meta-analysis of lumbar spine, femoral neck, and forearm BMD for SNVs present across both exome-sequenced and genome-wide cohorts i.e. SNV absent from all exome-sequenced cohort are not shown. e. Manhattan plot for the Meta-Analysis of Sex-Combined results for Lumbar Spine BMD for SNVs present in exome-sequenced and genome-wide cohorts i.e. SNV absent from all exome-sequenced cohort are not shown (from top to bottom: lumbar spine, forearm and femoral neck BMD).

