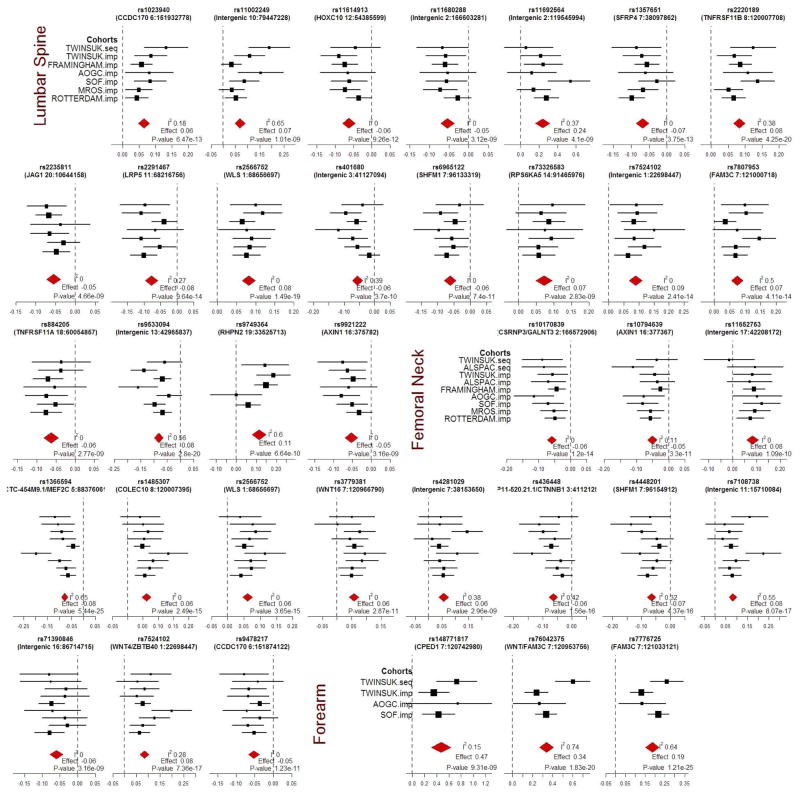
Extended Data Figure 2. Forest Plots by Cohort for Genome-wide Significant Loci from Discovery Meta-analysis.
Forest plots for three BMD phenotypes are shown. Title of each plot includes gene overlapping the SNV and its genomic position on build hg19. P-values are from fixed-effect meta-analysis (see Supplemental Information).

