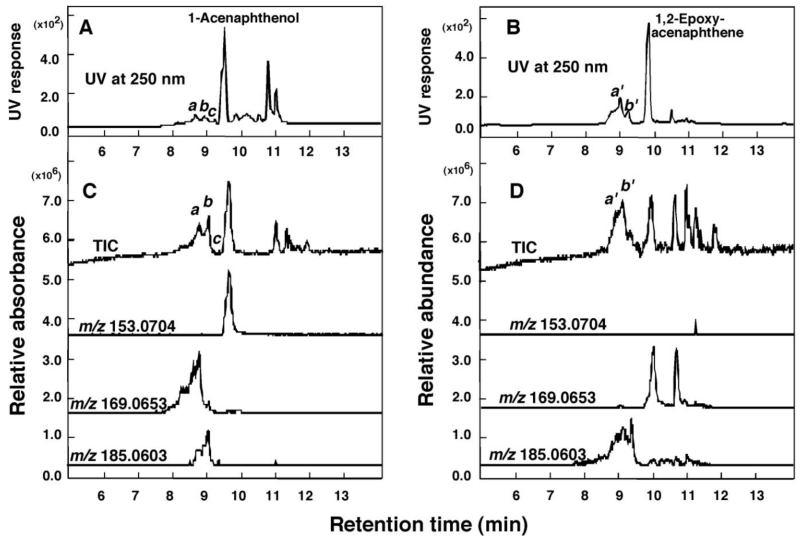
Figure 7.
Oxidation of 1-acenaphthenol (A) and 1,2-epoxyacenaphthene (B) at 50µM substrate concentration by a reconstituted monooxygenase system containing P450 2A13 or P450 2A6, respectively. Detection of oxidation products of 1-acenaphthenol and 1,2-epoxyacenaphthene was made using UV absorbance at 250 nm, TIC, and reconstructed chromatograms of m/z 153.0704, 168.0653, and 185.0903 (all in positive ion mode). Peaks obtained with UV and TIC were indicated a-d for 1-acenaphthenol products and a’ and b’ for 1,2-epoxyacenaphthene products and the mass spectra of these peaks are shown in Supporting Information Figure S6.

