. 2015 Dec 23;4:e11306. doi: 10.7554/eLife.11306

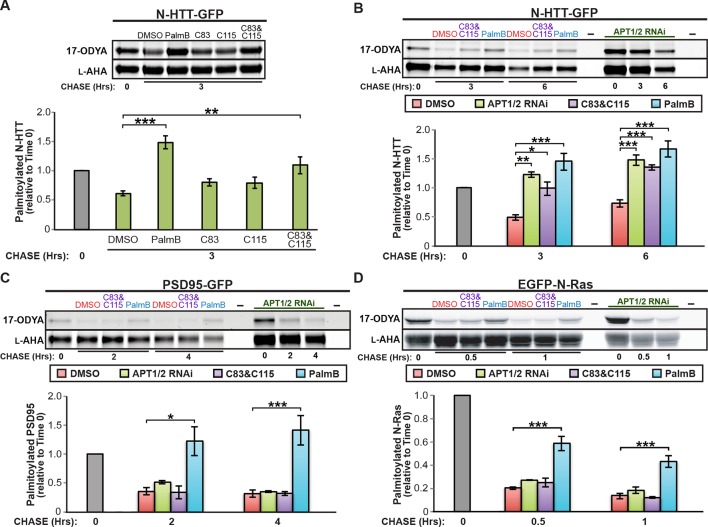
Figure 2. Downregulation of APT1 and APT2 inhibits HTT depalmitoylation but does not affect palmitate turnover on PSD95 or N-Ras.

(A) Pulse-chase analysis of N-HTT palmitoylation in the presence of DMSO, 10 μM PalmB, 10 μM APT1-selective inhibitor C83, and/or 10 μM APT2-selective inhibitor C115, as described in Figure 1. n = 3, mean ± SEM. (B-D) Pulse-chase analysis of (B) N-HTT, (C) PSD95, and (D) N-Ras after APT1 and APT2 knockdown (“APT1/2 RNAi”), treatment with DMSO, treatment with 10 μM C83 and 10 μM C115, or treatment with 10 μM PalmB, as described in Figure 1. n = 3, mean ± SEM. *p < 0.05; **p < 0.01; ***p < 0.001. SEM, standard error of the mean.

DOI: http://dx.doi.org/10.7554/eLife.11306.004

Figure 2.

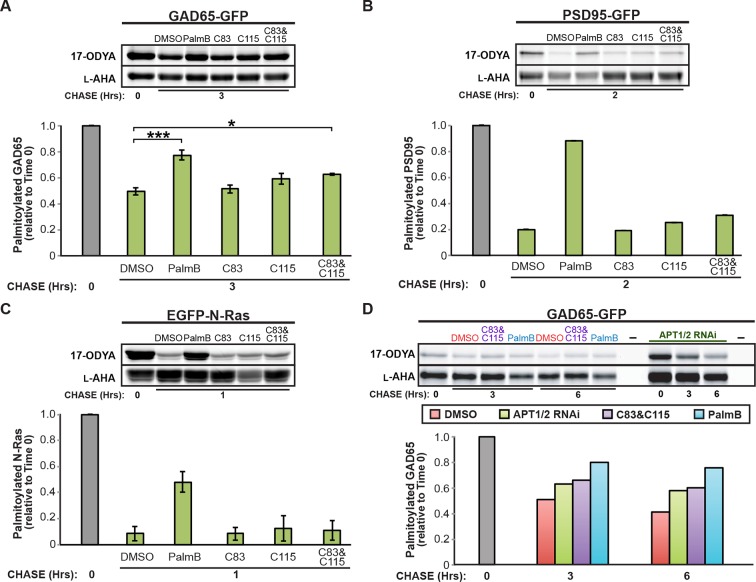
Figure 2—figure supplement 1. Downregulation of APT1 and APT2 inhibits GAD65 depalmitoylation but does not affect palmitate turnover on PSD95 or N-Ras.

Figure 2—figure supplement 1.

(A-C) Pulse-chase analysis of (A) GAD65, (B) PSD95, and (C) N-Ras palmitoylation in the presence of DMSO, 10 μM PalmB, 10 μM APT1-selective inhibitor C83, and/or 10 μM APT2-selective inhibitor C115, as described in Figure 2. (D) Pulse-chase analysis of GAD65 after APT1 and APT2 knockdown (“APT1/2 RNAi”), treatment with DMSO, treatment with 10 μM C83 and 10 μM C115, or treatment with 10 μM PalmB, as described in Figure 2. *p < 0.05; ***p < 0.001.