
Figure 1. The transition in PTB protein expression occurs during in vitro neuronal differentiation.
(A) HB9-GFP ESCs express eGFP under the MN-specific promoter HB9. The addition of retinoic acid (RA) and a Sonic hedgehog (Shh) agonist drives MN differentiation. (B) Western blot shows the loss of PTBP1 protein and gain of PTBP2 and GFP proteins as ESCs differentiate into HB9+ MNs. U170K served as a loading control. (C) Quantification of relative PTBP1 and PTBP2 protein expression across MN differentiation. Error bars represent standard error of the mean (SEM, n=2).
DOI: http://dx.doi.org/10.7554/eLife.09268.003
Figure 1—source data 1. Splicing changes identified by RNA-seq during ESC neuronal differentiation.
elife-09268-fig1-data1.xlsx (334.7KB, xlsx)
DOI: 10.7554/eLife.09268.004
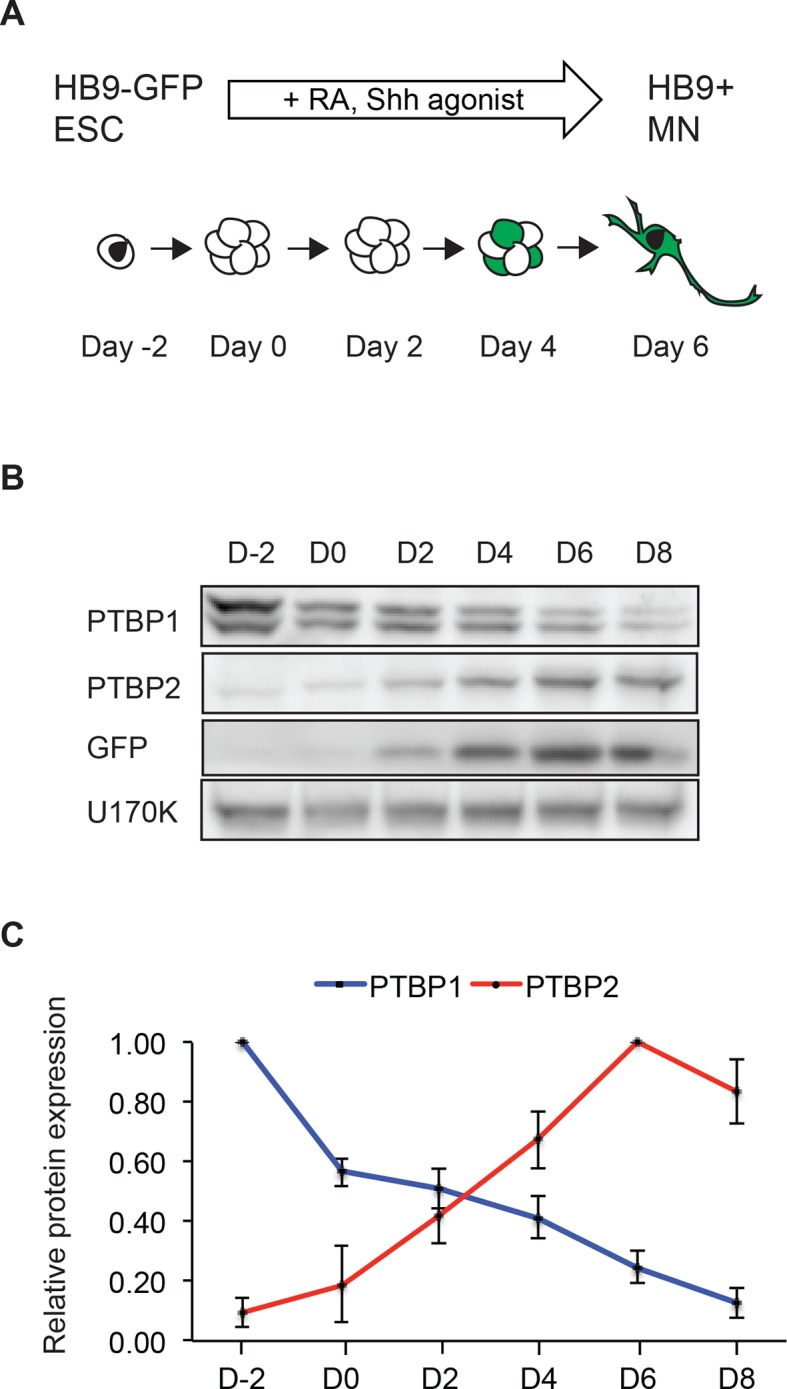
Figure 1—figure supplement 1. Transitions in PTB protein expression as ESCs differentiate into MNs, NPCs, and neurons.

(A) Day 2 MN cultures express Nestin. (B) Day 5 MN cultures co-express GFP and HB9. (C) Day 8 MN cultures co-express GFP and PTBP2. (D) Western blot of PTBP1 and PTBP2 protein expression in ESCs, sorted Day 5 GFP+ MNs, and sorted Day 8 GFP+ MNs. GAPDH served as a loading control. (E) NPC cultures homogenously express the progenitor marker Nestin, (F) while very few cells express the neuronal marker TuJ1. (G) Western blot and (H) quantification of PTBP1 and PTBP2 as ESCs differentiate into NPCs, Day 4 RA-derived neurons, and Day 6 MN cultures. U170K served as a loading control. Borders of western blots indicate different lanes within the same gel.
Figure 1—figure supplement 2. Transitions in alternative splicing occur during neuronal differentiation.

(A) Alternative splicing events in ESCs, NPCs, and GFP+ MNs were quantified using SpliceTrap (Wu et al., 2011). Bar graph and (B) heat map of cassette exons, 5’ and 3’ splice sites, and retained introns whose splicing differs between each sample pair (ΔPSI ≥ 15%) (Figure 1—source data 1). (C, D) Gene ontology analyses of genes showing the differential splice events compared to all expressed genes were performed using DAVID (FDR<0.05) (Huang et al., 2009a).