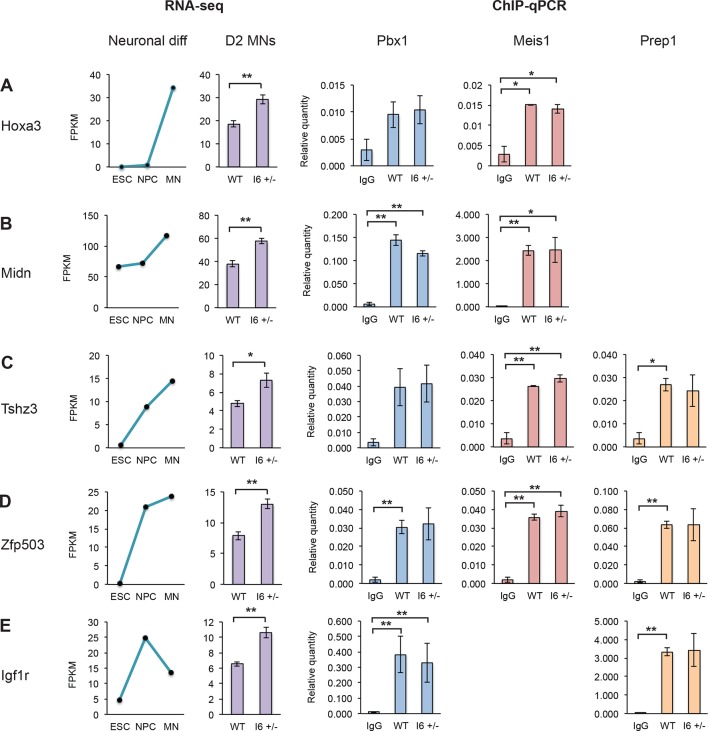
Figure 6. The early expression of Pbx1a promotes neuronal gene expression.
(A) Genome Browser tracks of aligned RNA-seq reads from wild type (top) and I6 +/- (bottom) Day 2 MN cultures. The asterisk (*) indicates Pbx1 exon 7, which is induced in the mutant. (B) Bar charts of the top 20 induced genes in the I6 +/- cell lines compared to expression in wild type cells (Figure 6—source data 1). Genes highlighted in bold have known roles in neuronal differentiation. Error bars indicate SEM. (C) Gene ontology analysis of the 196 genes induced by 1.5 fold in the I6 +/- cultures. (D) Hoxc5 expression increases during neuronal differentiation (left panel, Figure 6—source data 2) and the induction of Pbx1a. (E) Relative Pbx1 (left panel) and Meis1 (right panel) binding in D2 MN cultures (n=3). Statistical analyses were performed using Welch’s t-test (P-value<0.05*, <0.01**).
DOI: http://dx.doi.org/10.7554/eLife.09268.021


