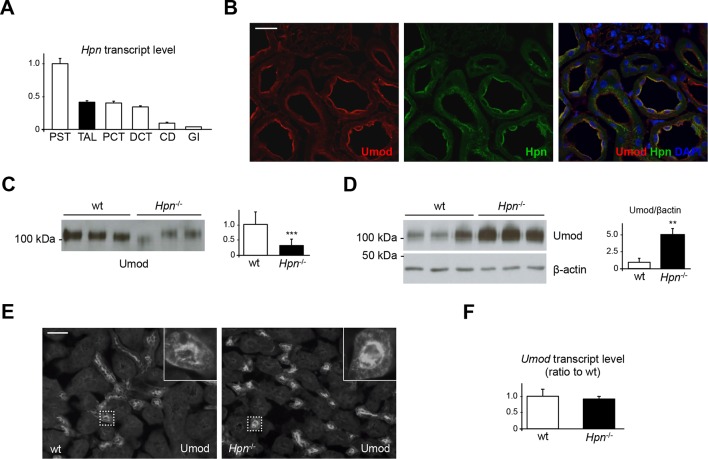
Figure 6. Defective uromodulin urinary secretion in mice lacking hepsin.
(A) Transcript level of Hpn, as assessed by Real-Time qPCR on microdissected nephron segments (normalised to Gapdh). Expression of Hpn is detected in proximal straight tubules (PST), thick ascending limb (TAL), proximal convoluted tubules (PCT), distal convoluted tubules (DCT) and, to a lesser extent, in collecting ducts (CD). Minimal expression of the protease is detected in glomeruli (GI). Bars indicate average ± s.e.m. of 3 independent experiments (Figure 6—source data 1). (B) Immunofluorescence analysis of mouse kidney sections showing co-localisation of endogenous hepsin and uromodulin on the apical plasma membrane of TAL epithelial cells. Scale bar, 20 µm. (C) Representative Western blot analysis of urinary uromodulin secretion in Hpn-/- mice or control animals. Urinary protein loading was normalised to urinary creatinine concentration. Densitometric analysis shows reduced uromodulin urinary secretion in animals lacking hepsin (average ± s.d., n = 10/group, Figure 6—source data 2). ***p<0.001 (Student’s t test). (D) Western blot analysis of uromodulin in kidney lysates of Hpn-/- mice or control animals. Beta-actin is shown as a loading control. Densitometric analysis shows accumulation of uromodulin in kidney lysates from Hpn-/- mice (average ± s.d., n = 3/group, Figure 6—source data 3). **p<0.01 (Student’s t test). (E) Representative immunofluorescence analysis showing apical plasma membrane signal of uromodulin in kidney sections from Hpn-/- mice or control animals. Scale bar, 50 µm. (F) Transcript level of Umod, as assessed by Real-Time qPCR on total kidney extracts from Hpn-/- mice or control animals (normalised to Hprt1). Expression of Umod is comparable between the two groups of animals (n = 3/group, Figure 6—source data 4). Bars indicate average ± s.e.m. (Student’s t test).
DOI: http://dx.doi.org/10.7554/eLife.08887.015

