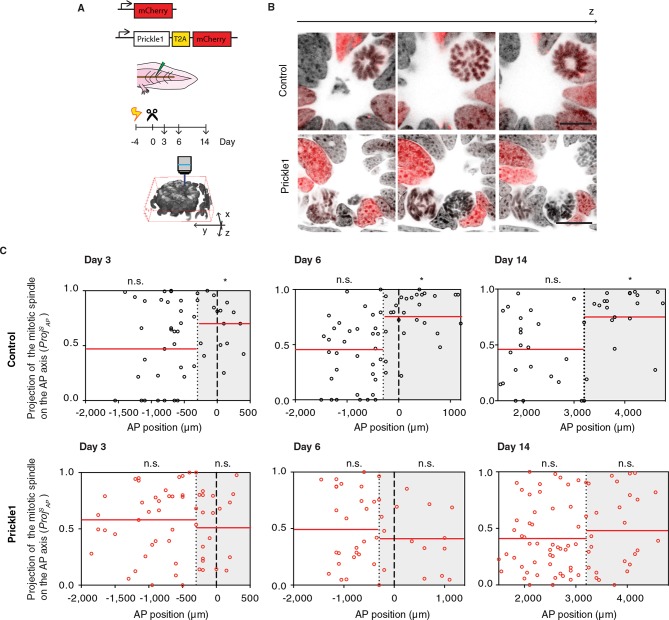
Figure 5. Prickle1 overexpression randomizes cell division orientation in the regenerating spinal cord.
(A) Spinal cord cells were electroporated either with a construct encoding for axolotl Prickle1, the T2A self-cleavage peptide, and mCherry, or mCherry alone. Amputated tails were allowed to regenerate 3, 6, and 14 days. Confocal z-stacks of electroporated cells in late anaphase or telophase were acquired for analysis. (B) Images show single optical confocal sections through representative dividing control cell (top, and Video 2) and Prickle1-overexpressing cell (bottom, and Video 3). Electroporated cells express nuclear mCherry (red). DNA is labeled with Hoechst (inverted grayscale). Scale bar, 10 μm. (C,D) Distribution of the projection of mitotic spindles on the AP axis in control (C and Prickle1-overexpressing cells (D) at day 3, day 6, and day 14 after amputation. Each dot represents a cell division. Dotted lines mark the boundaries of the Prickle1 zone (gray boxes) as calculated in Figure 3C. Dashed lines mark amputation planes. Red lines mark the mean value of ProjSAP. Note that control cells divide randomly within the Prickle1-negative zone (day 3 n=22 cells, day 6 n=34, day 14 n=22 cells), but show significant bias towards the AP axis within the Prickle1 zone (day 3 n=17 cells, day 6 n=27, day 14 n=21 cells). The bias to divide along the AP axis is lost in cells overexpressing Prickle1 within the Prickle1 zone (day 3 n=22 cells, day 6 n=18 cells, day 14=28 cells). Cells pooled from at least 4 tails/group. Statistics within the Prickle1 zone and the Prickle1-negative zone to test whether the distribution deviates from uniform more than two standard deviations. * p < 0.05, n.s. is not significant.
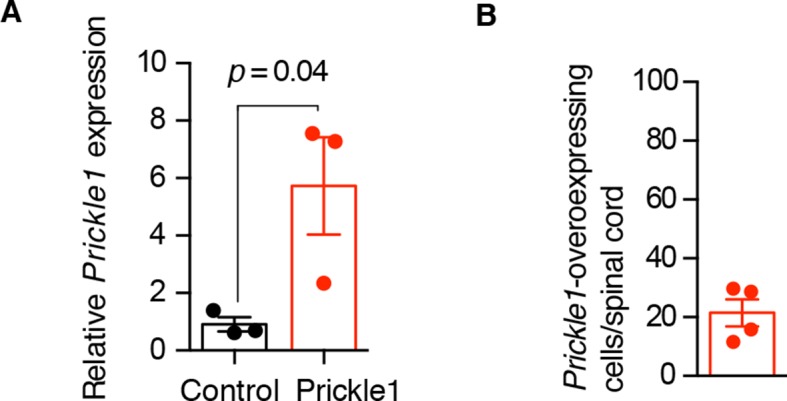
Figure 5—figure supplement 1. Characterization of Prickle1 expression in control and Prickle1-overexpressing spinal cords.


