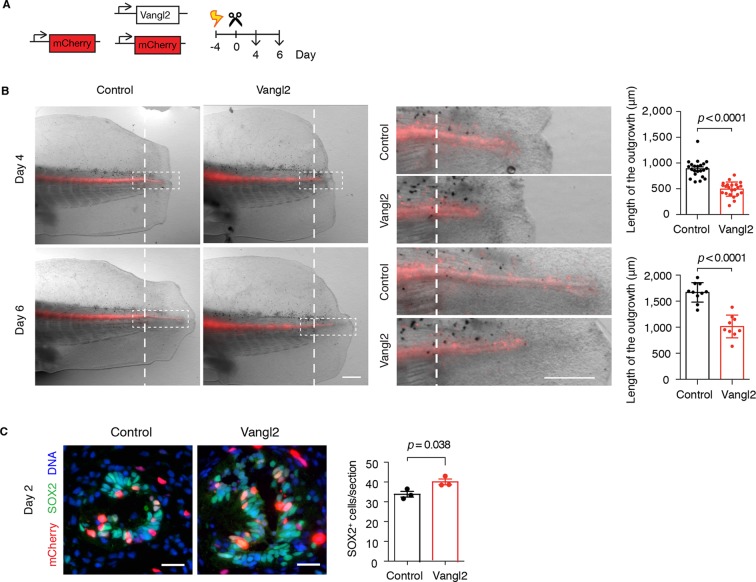
Figure 6. Vangl2 overexpression yields shorter and broader spinal cord outgrowth.
(A) Axolotl spinal cords were co-electroporated with Vangl2 and mCherry or mCherry alone as control, tails were amputated, and monitored during regeneration. (B) Representative images of control and Vangl2-overexpressing spinal cords at day 4 and day 6. Insets show spinal cord outgrowths. Dashed lines mark the amputation planes. Mean ± s.e.m. of spinal cord length on the right. Dots represent individual axolotls, pooled from two independent experiments. P values indicate the result of two-tailed unpaired Student's t-tests. Scale bars, 500 µm. (C) Immunofluorescence on cross-sections across the source zone of control and Vangl2-overexpressing spinal cords 2 days after amputation. SOX2 labels neural stem cells, mCherry labels electroporated cells, and Hoechst labels DNA. Mean ± s.e.m. of the number of SOX2+ cells per cross-section on the right. N=3 tails/group. P value indicates the result of two-tailed unpaired Student's t-test. Scale bars, 20 μm.

