
Figure 1. Task design and behavior.
(A) Each block began with the presentation of a target orientation, which observers maintained for the duration of a task block. Template presentation was followed by a serial stream of randomly oriented stimuli. Observers were asked to respond with a button press whenever the stimulus matched the template orientation. (B) Response frequency was highest for target trials, and dropped off sharply for non-targets with increasing angular distance between template and stimulus orientation. Error bars indicate standard error of the mean across observers. The black line denotes a von Mises distribution fit to the responses.
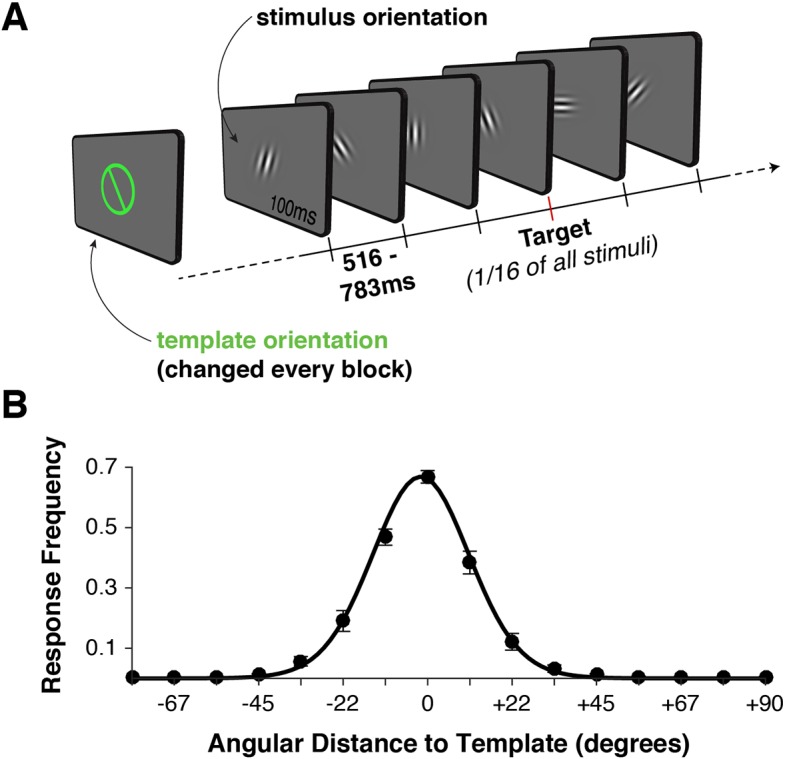
Figure 1—figure supplement 1. Reaction Time Distribution and Effects of Target Proximity.

(A) Distribution of reaction time frequencies (as a proportion of all responses), from stimulus onset (collapsing over hits and false alarms). Beginning around 400 ms after stimulus onset, response frequency rises rapidly up to approximately 550 ms, after which responses slowly taper off. (B) Target proximity (absolute angular distance between the stimulus and template angles) does not affect reaction time (F3,27 = 1.036, p = 0.393).