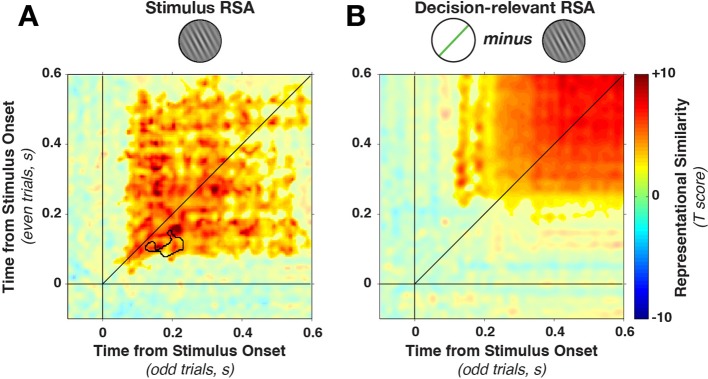
Figure 6. Cross-temporal generalization of representational similarity.
(A) Pearson correlations between stimulus-orientation-sorted distance matrices, calculated at different time points and on independent data sets. Color saturation shows significant cluster at the group level (permutation test). The cluster extends off the diagonal in a square, indicating substantial cross-temporal generalization. In addition, there is a small dynamic cluster (black outline), meaning that pairs of time points within the black outline showed significantly lower correlations than their corresponding time points on the diagonal (even though they were still significantly greater than 0). (B) shows the same analysis as in A, but sorting all trials by the decision-relevant angular distance. There were no significant dynamic clusters. RSA, representational similarity analysis.

