
Figure 7. Geometry of stimulus and template coding.
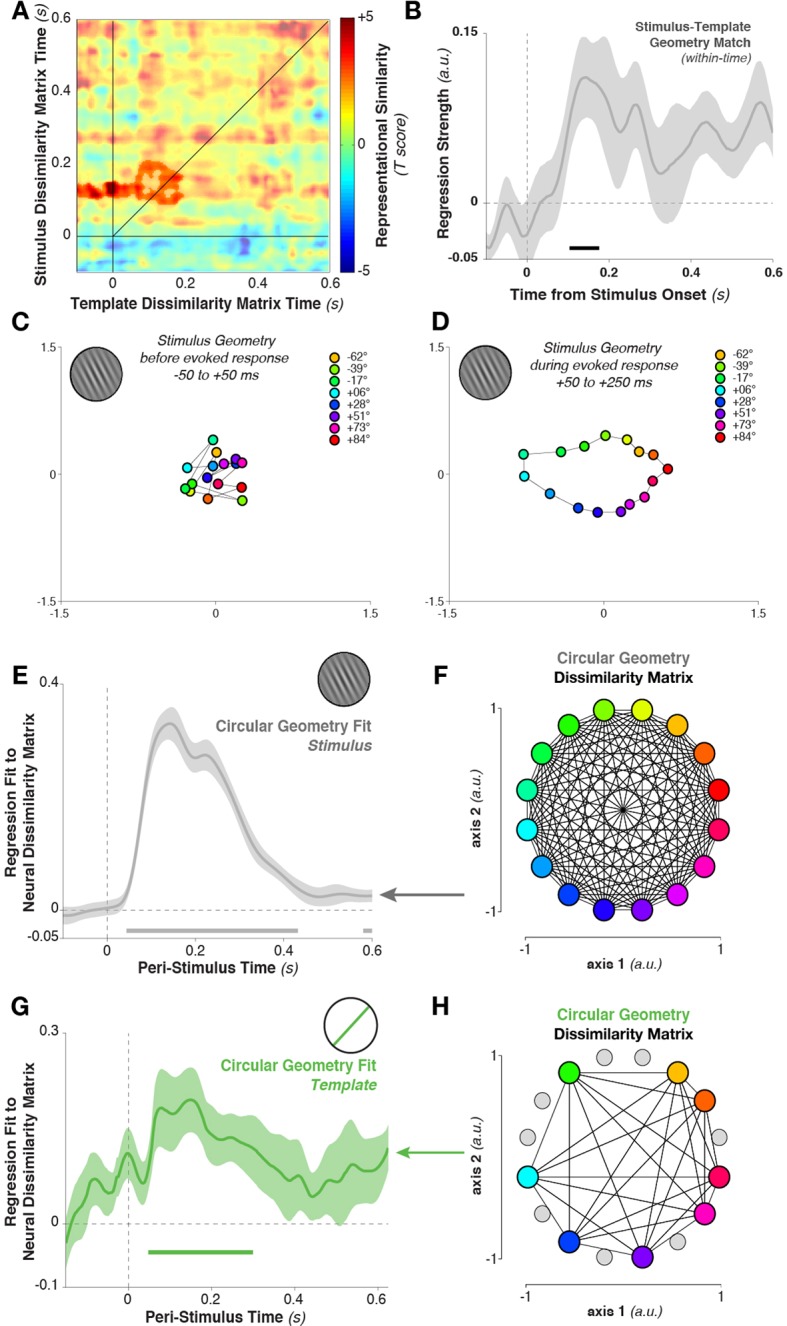
(A) The representational similarity structures between template- and stimulus-ordered responses were significantly correlated in the early stimulus-processing window (saturated colors indicate significant cluster). (B) The within-time comparison also showed a significant correlation in the representational similarity structure from 104 to 176 ms. Values correspond to the mean regression coefficient across all observers. Shading is between-subjects standard error of the mean. (C) Multi-dimensional scaling of the distances between stimulus orientations was not visible before stimulus onset. (D) Shortly after stimulus onset, the circular structure indicated that responses used a circular geometry. (E To quantify the representational structure over time, we fit (using regression) to the neural distance matrix between all angles (16 different angles, split randomly into two sets of trials, resulting in a 32×32 distance matrix of Mahalanobis distances) the distance matrix of a 16-point circular simplex, shown in (F). (G) Similarly, relationships between the eight template orientations fit a circular structure, particularly around stimulus onset time. (H) An example of a simplex from one session, with the eight chosen template angles highlighted in color, and the eight stimulus orientations which were never targets shown in gray.