. 2015 Dec 14;4:e09000. doi: 10.7554/eLife.09000

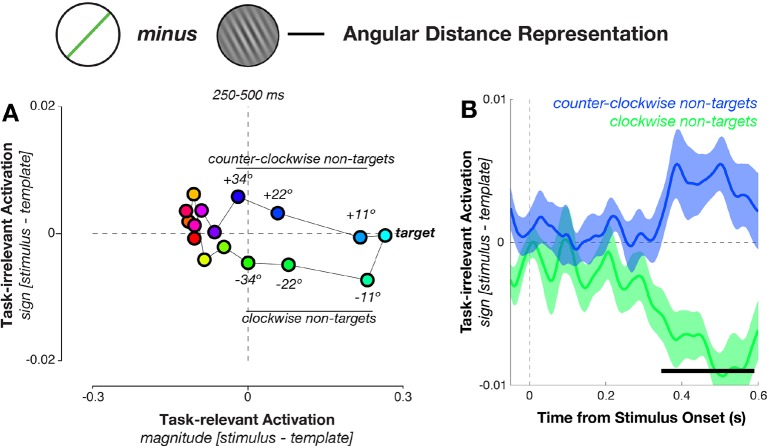
Figure 8. Geometry of response-related coding.

(A) Dissimilarity structure of angular distances. Data dimensionality was reduced using PCA, and weights calculated between sensor activity and different task variables using independent training data. Mean responses for each angular distance, calculated using the left-out data, were then projected via the calculated weights onto the task axes (the magnitude and sign of the angular distance). Since the task relevance of a particular angular distance was defined solely by its magnitude, projections onto the sign axis measured sensitivity to task-irrelevant signed differences between conditions. Prior to decision onset (250–500 ms after stimulus onset), the neural geometry is elliptical: in addition to conditions separating along the target-relevant magnitude axis (horizontal), near non-targets separate along the task-irrelevant sign axis (vertical). (B) Task-irrelevant coding emerges approximately 350 ms after stimulus onset. Time courses for the three nearest non-targets (11º, 22º, 34º offset from target angle) separate along the task-irrelevant axis, depending on whether they are clockwise or counterclockwise to the target.

DOI: http://dx.doi.org/10.7554/eLife.09000.011

Figure 8.

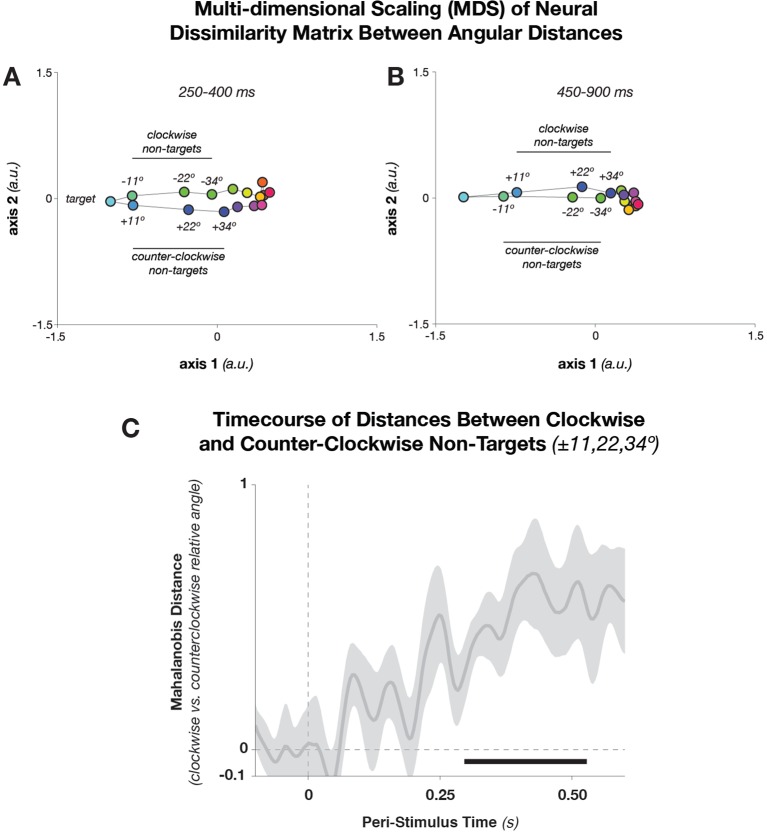
Figure 8—figure supplement 1. Multidimensional Scaling and Pairwise Mahalanobis distances between Angular Distances.

Figure 8—figure supplement 1.

(A) Dissimilarity structure of angular distances. We used MDS, which maps the multidimensional (32× 32) Mahalanobis distance matrix between target-relative angles into two dimensions. During relatively early stimulus processing (250–400 ms after stimulus onset), geometry is elliptical—that is, in addition to conditions separating along the target-relative axis (horizontal), conditions separate along a task-irrelevant axis (vertical). During later processing stages (B: 450–900 ms), the task-related axis accounts for most of the condition differences. Since MDS is rotation-invariant, the solution in B happens to have flipped axis 2, without affecting the geometrical relationship between points. (C) Mahalanobis distances (shuffle-corrected) between trials with equal target proximity, but different direction (i.e., clockwise vs. counter-clockwise deviations of the stimulus angle, with respect to the template angle). The figure shows the mean z-score (with respect to 250 random permutations of the trial labels) of pairwise distances between equal target proximities, averaged over the pairs ± 11.25º, ± 22.5º, and ± 33.75º. Shading indicates standard error of the mean. The black bar denotes significant time points (p<0.05, cluster-corrected). MDS, multi-dimensional scaling
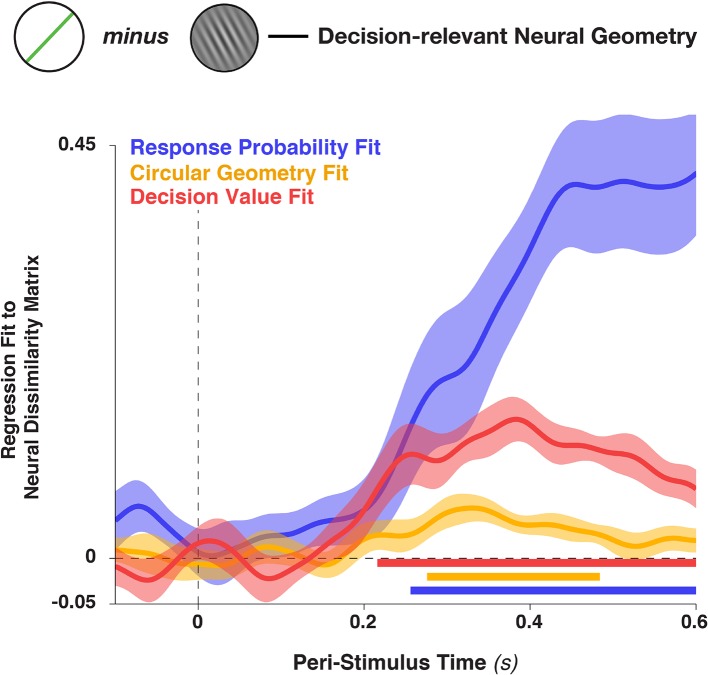
Figure 8—figure supplement 2. Figure is identical to Panel 8c, but includes in the graph the fit to the distance matrix provided by the linear decision value (i.e., the unsigned target proximity, stimulus—target ).

Figure 8—figure supplement 2.

This variable was also included in the analysis described in the main text, but omitted from Figure 8C for clarity (since it a nuisance variable). Shading indicates standard error of the mean and colored bars at the bottom denote significant time points for each regressor (p<0.05, cluster-corrected).
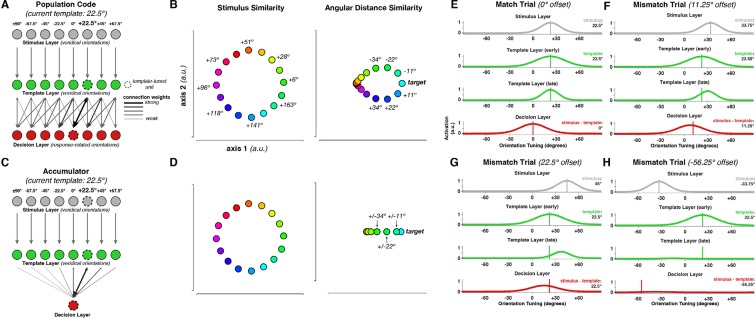
Figure 8—figure supplement 3. Neural Population Model.

Figure 8—figure supplement 3.

(A) Probabilistic population code model architecture. (B) Dissimilarity structure of responses in the stimulus layer (left panel) and the decision layer (right panel). (C) Accumulator model architecture. In contrast to the population code, decision value here is represented only in a single node (red unit in the decision layer). Otherwise, the architectures are identical. (D) Dissimilarity structure of responses in the accumulator model. While responses in the stimulus layer are identical in both cases, the decision layer differs from the population code model, in that the magnitude, but not the direction, of angular differences between stimulus and template, is represented. (E) Model response on an exact template match trial. (FH) Model responses on mismatch trials.