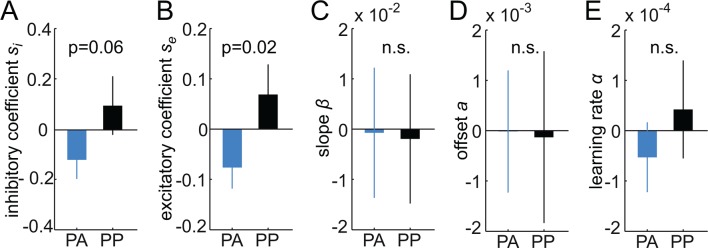
Figure 5. Estimates of individual differences in model parameters.
(A-–E) Each bar plot depicts the average difference between model parameters estimated based on the whole group (N) and a reduced group when one subject is left out (N-1). Values are averaged according to the group of the left out subject (i.e. PA or PP). Positive values indicate that removing subjects from the group decreased the parameter estimates in the N-1 group. Amisulpride reduced parameters controlling the width of generalization (width of inhibitory and excitatory generalization coefficients, A, B) but had no effect on the slope (C) and offset of responding (D), as well as the learning rate (E). P-values are based on two-sample t-tests. Error bars are SEM for N = 25 (PA) and N = 21 (PP).

