
Figure 5. Precocious dissociation of bivalents into univalent contributes to aneuploidy.
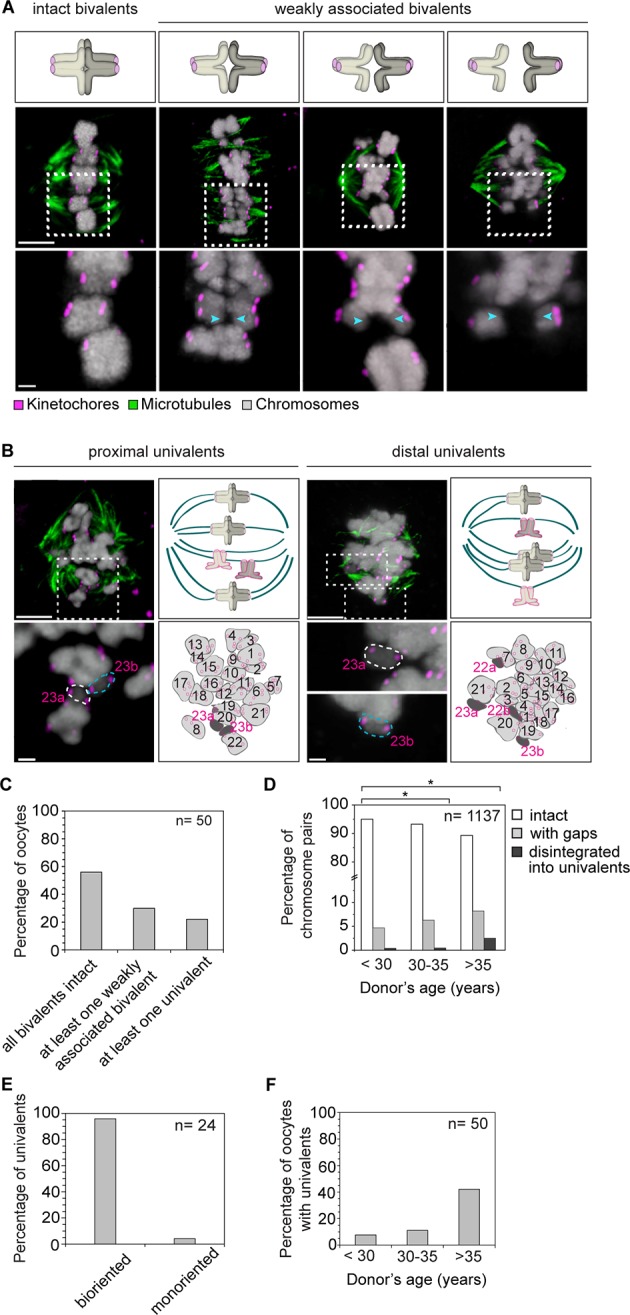
(A) Illustrations and representative images of homologs showing gaps between weakly-associated bivalents (indicated by arrowheads). Scale bar represents 5 µm in overviews and 1 µm in insets. (B) Representative immunofluorescence images and illustrations showing complete disintegration of bivalents into two proximally or distally positioned univalents. Lower panel insets and cartoons show univalents (dark grey, numbered in magenta) and bivalents (light grey, numbered in black) that were determined by manual tracing and identification of homologs within the spindle. Scale bar represents 5 µm in overviews and 1µm in insets. (C) Quantification of weakened chromosome arm cohesion and bivalent disintegration in 50 human oocytes. (D) Proportion of intact, weakly-associated (with gaps) or disintegrated bivalents amongst 1,137 chromosomes across different age groups. * p≤0.05 (Fisher’s exact test). Significance analyses were performed for changes relative to <30 years old age group. (E) Proportion of univalents that achieved bi-orientation on the meiosis I spindle. (F) Proportion of human oocytes that contained at least one univalent pair across different age groups.