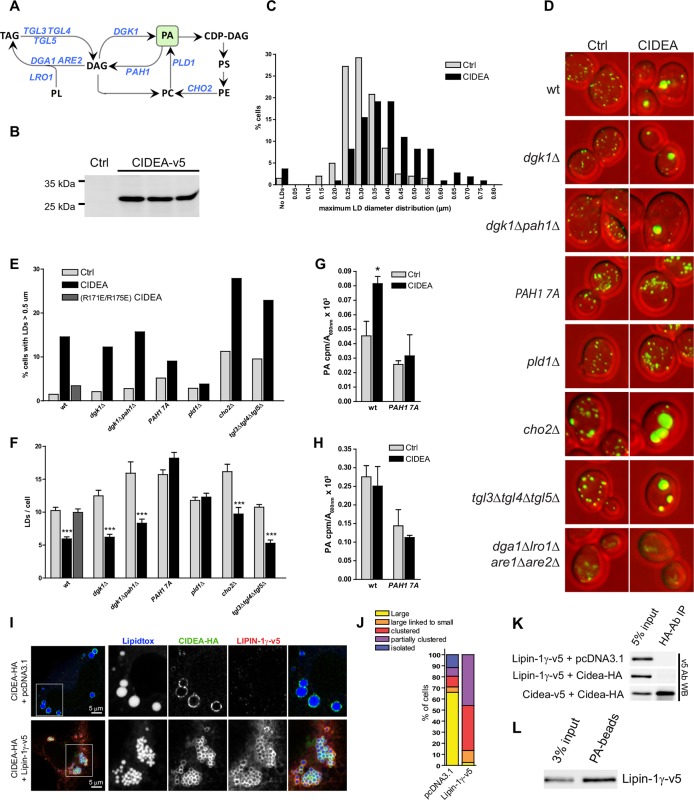
Figure 6. CIDEA is functional in yeast and requires PA.
(A) Pathway showing the reactions catalyzed by the enzymes altered in the studied yeast strains. (B) Stable expression of mCIDEA-v5 in three transformed yeast clones. (C) Frequency distribution of the diameter of the largest LD per cell. (D) LD staining in the studied yeast strains transformed with pRS316-CYC1p-Cidea or the empty vector. (E, F) Quantification of LD size and number per cell in randomly acquired images (100–200 cells/condition). CIDEA activity in yeast was measured by its ability to increase the percentage of cells with supersized LDs (E) and reduce the total number of LDs per cell (F). (G, H) Effect of CIDEA and PAH1-7A expression in the cellular levels of PA (G) and its synthesis rate (H). Three different yeast clones per condition were analysed, and results are shown as the mean ± SEM. One-way ANOVA with Bonferroni post-test was performed to determine significant differences due to the presence of CIDEA (*p<0.05; ***p<0.001). (I–L) Coexpression of hLIPIN-1γ-v5 and CIDEA-HA in Hela cells. (I) Representative immunofluorescence images showing LD staining (blue) in Hela cells expressing CIDEA-HA (green) in the presence or absence of hLIPIN-1γ-v5 (red). Twenty-four hours after overexpression of hLIPIN-1γ-v5, cells were transfected with pcDNA3.1/Cidea-HA and incubated for a further 24 hr. (J) Phenotypic distribution in randomly selected cells (n>50) showing the average values for three independent experiments. (K) Co-IP assay in lysates of transfected Hela cells. (L) PA beads binding assay for hLIPIN-1γ-v5. Each co-IP and PA-binding assay was performed at least in triplicate, producing similar results in each experiment.
DOI: http://dx.doi.org/10.7554/eLife.07485.016

