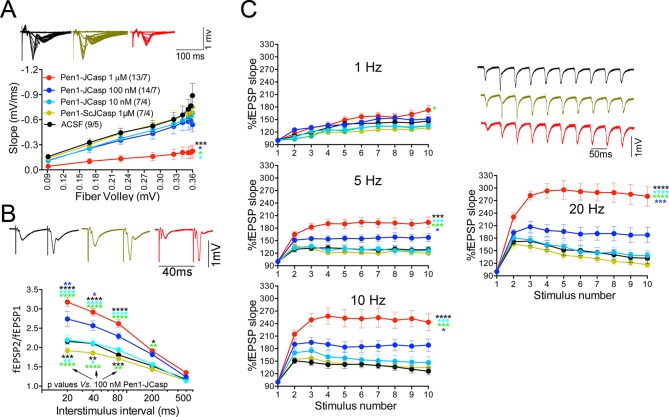
Figure 3. Pen1-JCasp impairs synaptic plasticity.
(A) CA1 recordings of hippocampal slices incubated with either artificial cerebrospinal fluid (ACSF), 1 μM Pen1-ScJCasp or Pen1-JCasp at the indicated concentrations. The synaptic input/output (I/O) relationship was obtained by plotting the fiber volley amplitude against the initial slope of the evoked field excitatory postsynaptic potential (fEPSP). Representative traces are shown on top. The slope values of I/O recording for each group were compared for statistical assessments. It has been found that 1 μM Pen1-JCasp significantly reduces synaptic transmission as compared to ACSF (*), Pen1-ScJCasp (*), 10 nM (*), and 100 nM Pen1-JCasp (*p). Representative traces are shown. (B) Average paired-pulse facilitation (PPF) (2nd fEPSP/1st fEPSP) plotted as a function of the inter-stimulus interval. Representative traces of fEPSPs evoked at 40 ms inter-stimulus interval are shown. Pen1-JCasp increases PPF. (C) Synaptic facilitation elicited by stimulus trains at 1, 5, 10, and 20 Hz. fEPSP slopes are normalized to the slope of the first fEPSP of the stimulus train. Representative traces of fEPSPs evoked at 20 Hz are shown. Stimulus artifacts are removed for clarity. Pen1-JCasp increases frequency facilitation (FF) in a frequency and dose-dependent manner. Statistical assessments were performed by: one-way analysis of variance (ANOVA) followed by Tukey’s multiple comparisons test for slopes of I/O curves; two-way repeated measures (RM) ANOVA followed by Tukey’s multiple comparisons test for PPF and FF (*p < 0.05; **p < 0.01; ***p < 0.001; ****p < 0.0001). In FF, 10 nM Pen1-JCasp increased facilitation in a statistically significant manner only at the 10th stimulation (indicated with (*) and (*)). The number of recordings and the number of mice analyzed for each group are shown in (C). All data represent means ± SEM. The complete statistical analyses are shown in the attached Excel file.
DOI: http://dx.doi.org/10.7554/eLife.09743.006

