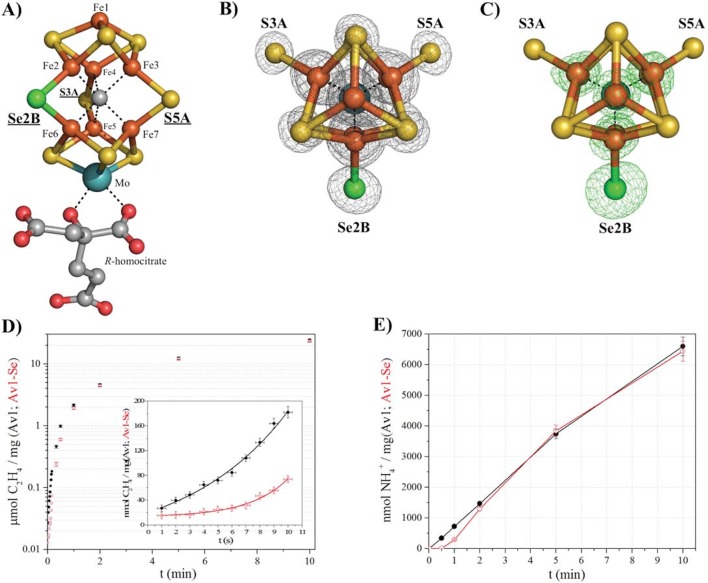
Figure 1. Selective Se-incorporation into the active site of the MoFe-protein.
(A) Side view of FeMoSe-cofactor ([7Fe:8S:1Se:Mo:C]-R-homocitrate) in Av1-Se2B at a resolution of 1.60 Å, highlighting the S2B replacement by Se. (B) View along the Fe1-C-Mo axis. The electron density (2Fo-Fc) map is contoured at 5.0 σ and represented as grey mesh. The 2Fo-Fc density at the Se2B site is significantly increased compared to the S5A and S3A sites. (C) Same orientation as B) superimposed with the anomalous difference Fourier map calculated at 12,662 eV (green) at a resolution of 1.60 Å contoured at 5.0 σ showing the presence of anomalous electron density arising from Se. Fe atoms are shown in orange, S in yellow, Se in green, Mo in turquoise, C in grey, and O in red. (D) Acetylene reduction activity of Av1 (black) compared to Av-Se (red). (E) Ammonia formation from reduction of the natural substrate, N2, was determined for Av1 (black) and Av1-Se (red). Error bars represent standard deviations from three measurements.
DOI: http://dx.doi.org/10.7554/eLife.11620.003
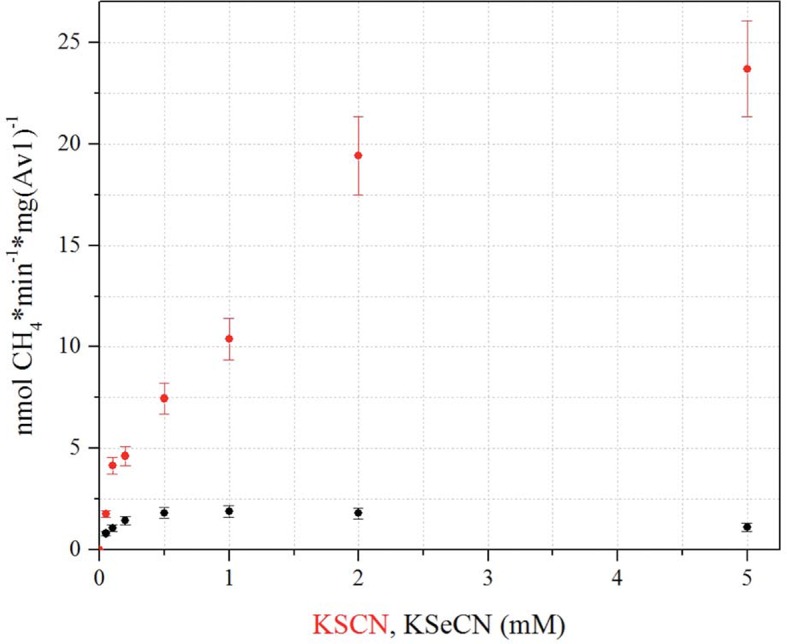
Figure 1—figure supplement 1. CH4 production based on KSeCN and KSCN as substrates.

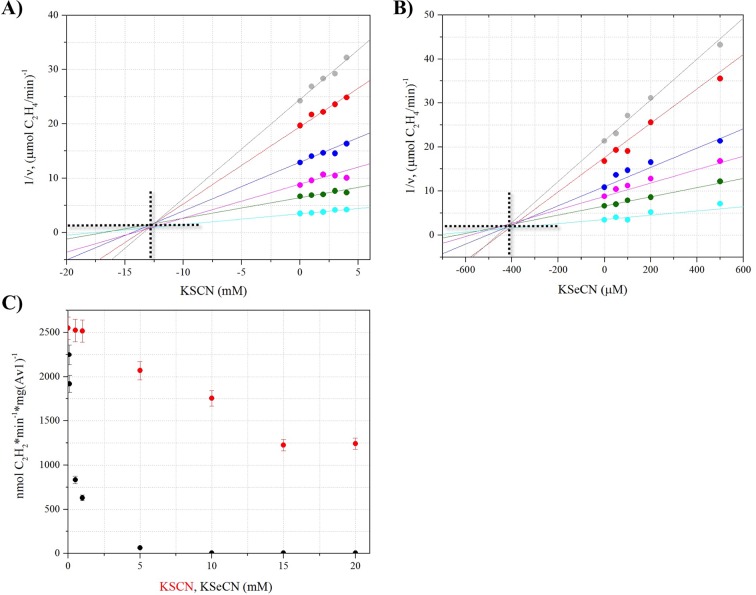
Figure 1—figure supplement 2. Inhibition of acetylene reduction by KSeCN and KSCN.
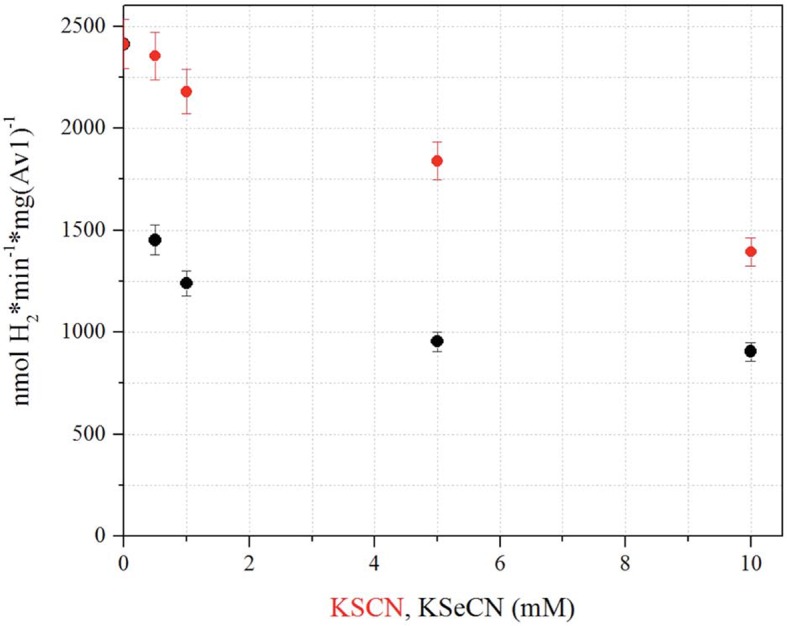
Figure 1—figure supplement 3. Influence of KSeCN and KSCN on proton reduction.


