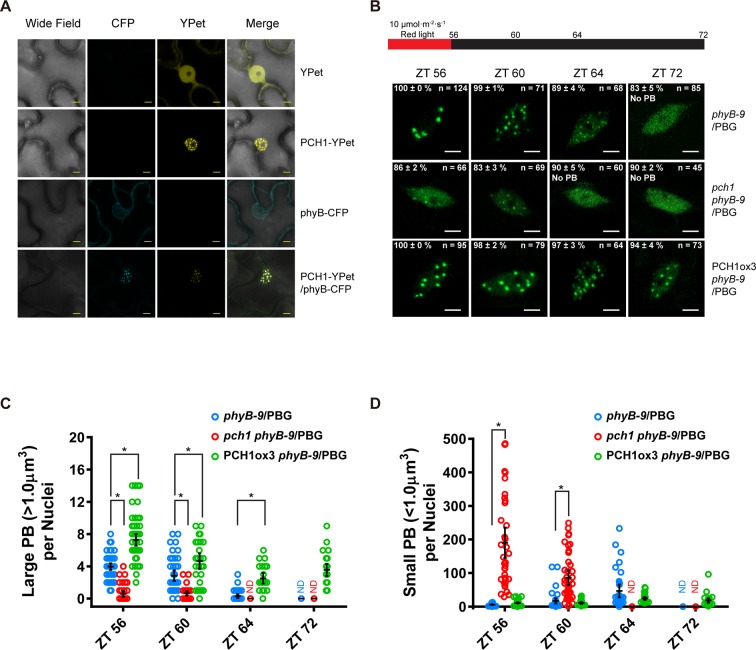
Figure 5. PCH1 is localized in the nucleus to stabilize phyB-containing photobodies.
(A) PCH1-YPet is nuclear localized when transiently expressed in tobacco and co-localizes with phyB-CFP to photobodies. YPet alone was used as control. Scale bars = 25 µm. (B) Representative confocal images showing phyB-GFP-containing photobodies in phyB-9, pch1 phyB-9 and PCH1ox3 phyB-9 plants at indicated time points during light-to-dark transition. Plants were entrained in short days with 10 µmol·m-2·s-1 of red light for two days before transferring to extended dark (ZT 56 to 72). The representative images were picked based on the photobody morphology of the majority of the nuclei (>50%). The percentage of nuclei showing the corresponding photobody patterns (with or without photobodies) were calculated based on three independent experiments. N represents the total number of nuclei analyzed for each time point. Scale bars equal to 5 μm. No PB = photobodies not detected. (C) and (D) compare quantitative measurements of large (>1 μm3, C) or small (<1 μm3 , D) phyB photobodies in all backgrounds. Mean ± 95% CI (n ≥ 29). ND = no PB of according size were detected. * symbol indicates significantly different (p<0.05, see text for more details about each p value).


