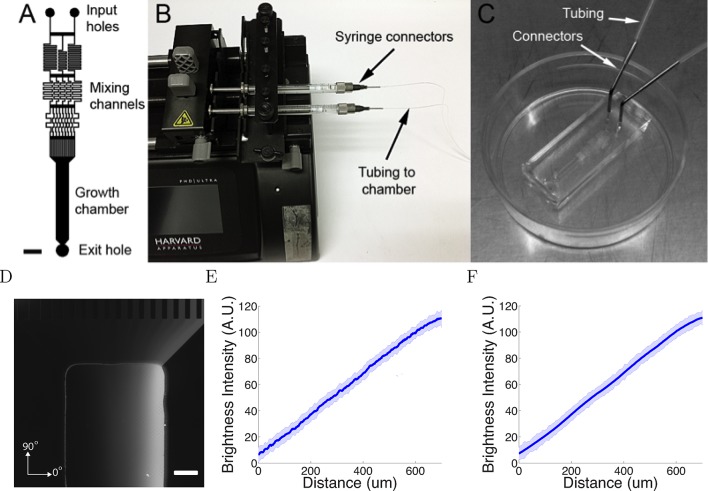
Figure 3. The microfluidic assay.
(A) The design of the chamber: the two solutions were pumped into the inlets and mix in the mixing channels before flowing into the growth chamber where the cells are plated. The mixing channels were of height 50 μm and width 50 μm. Scale bar 1 mm. (B, C) Photo of the experimental setup: two glass syringes attached to a Harvard pump injected the solutions into the chamber bonded on a 35 mm plastic plate. (D) Two solutions, one of which contained 0.1% (v/v) dextran fluorescently labelled with tetramethylrhodamine, were used to visualize the gradient. Brighter regions indicate higher concentrations. Scale bar 200 μm. (E, F) Line-scan measurements of fluorescence intensity across the device show a linear gradient which persists for at least 20 hr ( = 0h (E) and = 20h (F) ). The shaded errorbars show standard deviations across 10 chambers.
DOI: http://dx.doi.org/10.7554/eLife.12248.008

