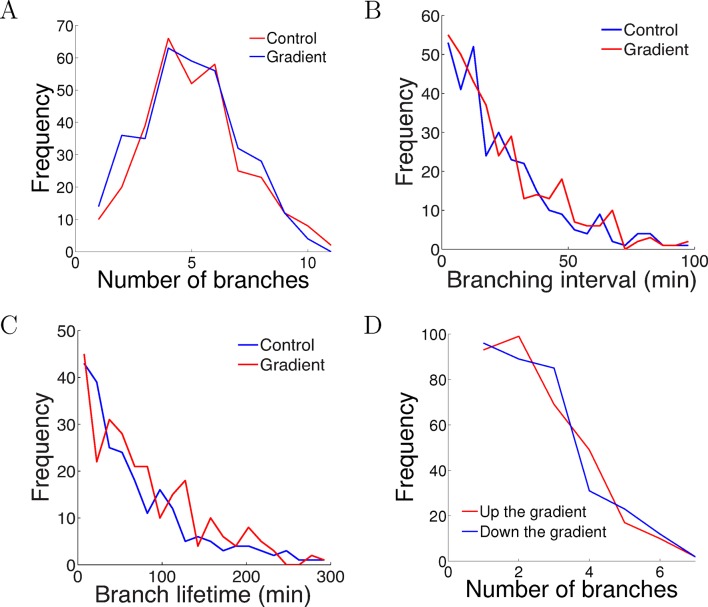
Figure 5. The gradient did not affect branch extension and retraction rates.
(A) Histogram of the number of cells with different numbers of branches after 5 hr of growth. The number (mean ± std) of branches per neuron in the control condition was 4.2 ± 1.8 (n=324 cells) and in the gradient condition was 4.4 ± 1.9 (n=297 cells), p = 0.9 Kolmogorov–Smirnov test. (B) The distribution of interval times between two successive branching events of the same cell. The interval (mean ± std) in the control condition was 23.1 ± 22.8 min (n=315 intervals) and in the gradient condition was 24.1 ± 23.5 min (n=287 intervals), p = 0.7 KS test. (C) Branch lifetime (mean ± std) in the control condition was 87 ± 79 min (n=245 branches) and in the gradient condition was 92 ± 81 min (n=213 branches), p = 0.2 KS test. (D) Histogram of the number of branches pointing up the gradient vs down the gradient (p = 0.8, KS test).
DOI: http://dx.doi.org/10.7554/eLife.12248.012

