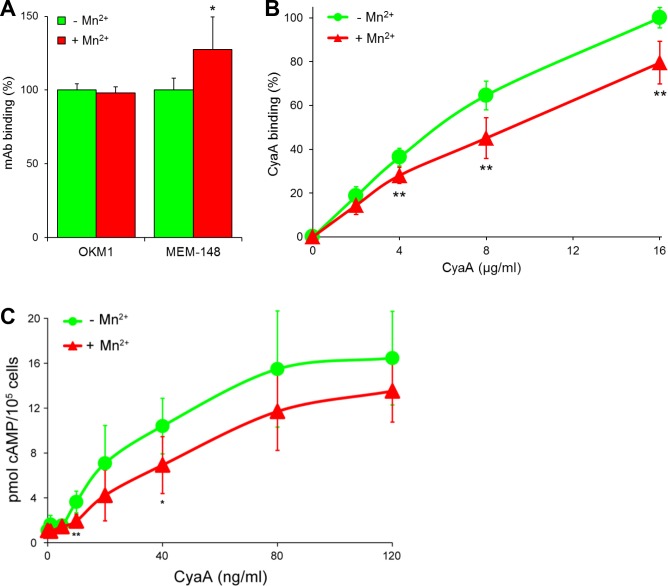
Figure 5. CyaA preferentially recognizes the inactive (bent) conformation of CR3.
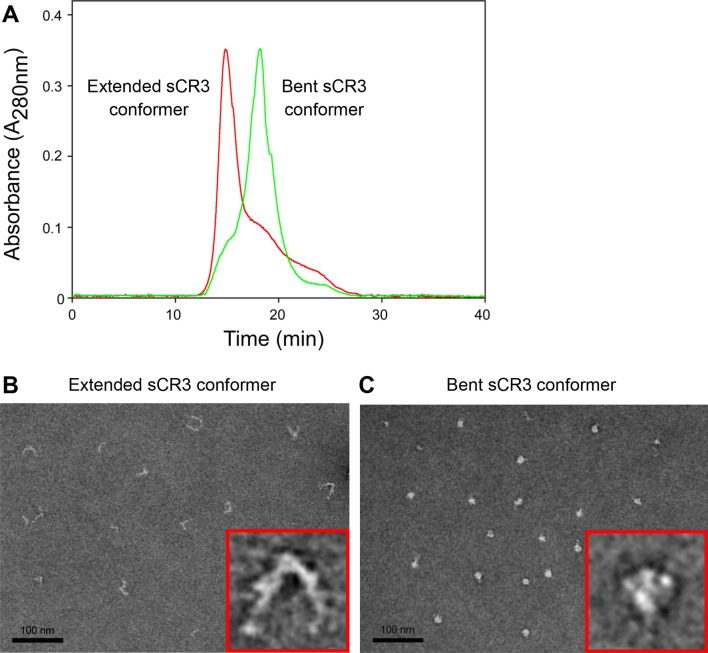
(A, B) A leukocyte-enriched fraction prepared from fresh whole blood was treated without or with 100 nM PMA to activate CR3. The cells were promptly stained with the OKM1 mAb recognizing both CR3 conformations, or with the MEM-148 mAb recognizing the extended integrin conformation (A), or with different concentrations of Dy647-labeled CyaA (B) in a combination with anti-CD14 mAb. After 2 min, cells were analyzed by flow cytometry, monocytes were gated based on light-scatter characteristics and expression of CD14 and used for calculation of mAbs and CyaA binding. Binding of mAbs, or CyaA (at the highest tested concentration) to PMA-untreated cells was taken as 100%. Each value represents the mean with SD of three independent experiments performed in duplicate using three different donors. Significant differences between mean values of mAbs or CyaA binding to cells treated with buffer alone and cells treated with PMA are shown (*, p<0.05; **, p< 0.01; ***, p<0.001; Student’s t-test). (C) 1x10⁵ human primary monocytes were pretreated without or with 100 nM PMA and incubated with indicated concentrations of CyaA. The amounts of accumulated cAMP were determined in cell lysates by ELISA. Each point represents the mean value ± SD of seven independent experiments performed in duplicate using cells of seven different donors. Significant differences between mean values of cAMP intoxication of monocytes incubated in the absence and in the presence of PMA are shown (*, p<0.05; ***, p<0.001; ****, p<0.0001; Student’s t-test). (D-G) The bent and extended conformers of sCR3 were immobilized to a Bio-Rad ProteOn XPR36 GLC sensor chip and the MEM-48 mAb recognizing both conformations of sCR3 (D), or the MEM-148 mAb recognizing the extended integrin conformation (E) were used as controls. To analyze the interaction between the bent (F), or extended (G) conformation of sCR3 and the toxin, CyaA∆H was passed over the chip surface at concentrations of 20, 40, 80, 160 and 320 µg/ml. The data were analyzed by global fitting of the response curves using a bivalent analyte model and calculated kinetic parameters are given in Table 1.


