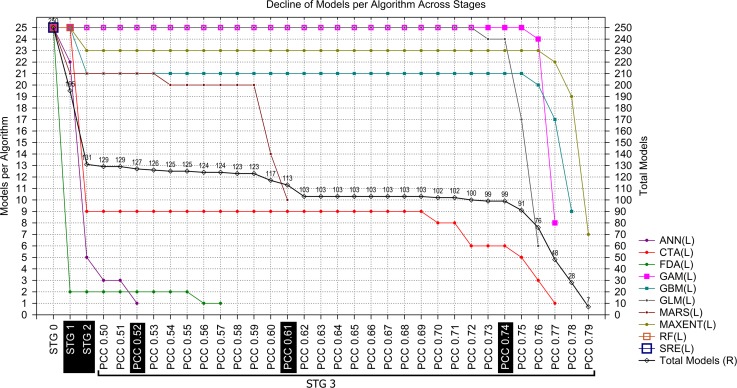
Fig 3. Progressive decrease of models per algorithm across stages (and across PCCs in Stage 3).
Stage 0: the total number of models per algorithm from the Biomod2 output before selection. Stage 1: Models that yielded TSS ≥ 0.8. Stage 2: Models that yielded an Invasive Hit Rate (IHR) ≥ the total IHR average. Stage 3: Models that yielded a total average paired Pearson´s correlation coefficient (average of paired PCC values between itself and all others) above each predefined threshold.

