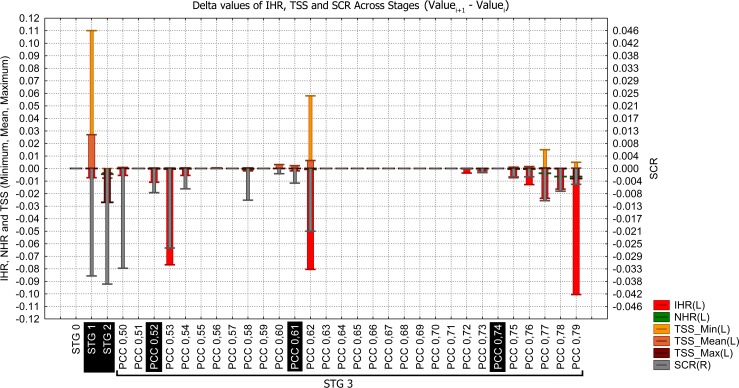
Fig 5. Difference between the current value minus the preceding one (delta value) of each evaluation index across stages.
This plot facilitated the identification of three marked changes across the PCC range (PCC: 0.53, 0.62, 0.79) and the sequence of changes from PCC 0.75 to 0.79 used to select the OPMs (PCC: 0.52; 0.61; 0.74) that built the final ensemble model.

