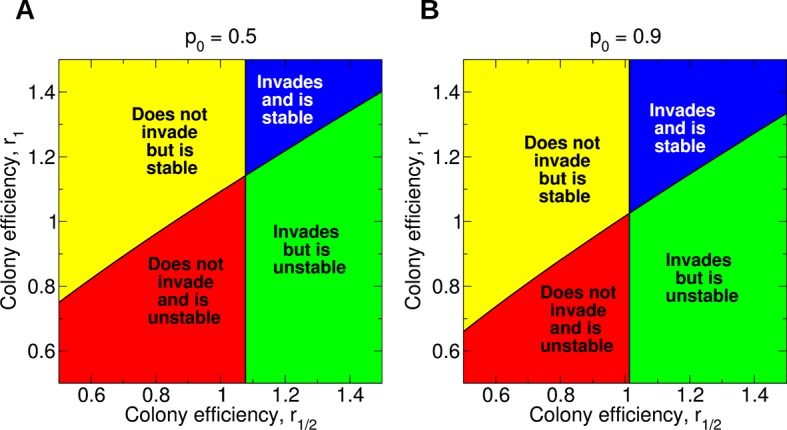
Figure 5. Evolution of non-reproductive workers for single mating (n = 1).

We consider a recessive sterility allele, a. There are four possible scenarios: The mutant allele cannot invade but is evolutionarily stable (bistability); the mutant allele can invade and is evolutionarily stable; the mutant allele can invade but is unstable (coexistence); the mutant allele cannot invade and is unstable. Only three parameters matter: p0, r1/2, and r1; p0 denotes the fraction of male offspring that come from the queen if there are no sterile workers in the colony (z = 0); r1/2 and r1 denote respectively the reproductive rate (efficiency) of the colony if z = 1/2 and z = 1 of all workers are sterile. The baseline value is r0 = 1. (A) Phase diagram for p0 = 0.5. (B) Phase diagram for p0 = 0.9. As p0 gets closer to 1, the intersection of the critical curves approaches the point (r1/2,r1) = (1,1).
