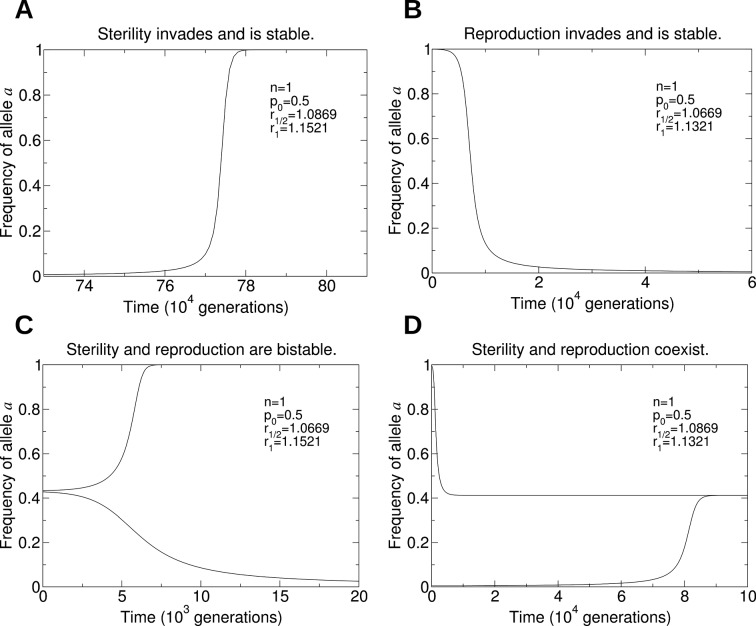
Figure 6. Numerical simulations of the evolutionary dynamics that show the four behaviors in Figure 5A.
The sterility allele is recessive, and we consider single mating (n = 1). For each of the four panels, we use the initial conditions: A: and ; B: and ; C: and (lower curve), and and (upper curve); D: and (lower curve), and and (upper curve). We set r0 = 1. A: Parameters p0 = 0.5, r1/2 = 1.0869, and r1 = 1.1521. B: Parameters p0 = 0.5, r1/2 = 1.0669, and r1 = 1.1321. C: Parameters p0 = 0.5, r1/2 = 1.0669, and r1 = 1.1521. D: Parameters p0 = 0.5, r1/2 = 1.0869, and r1 = 1.1321.

