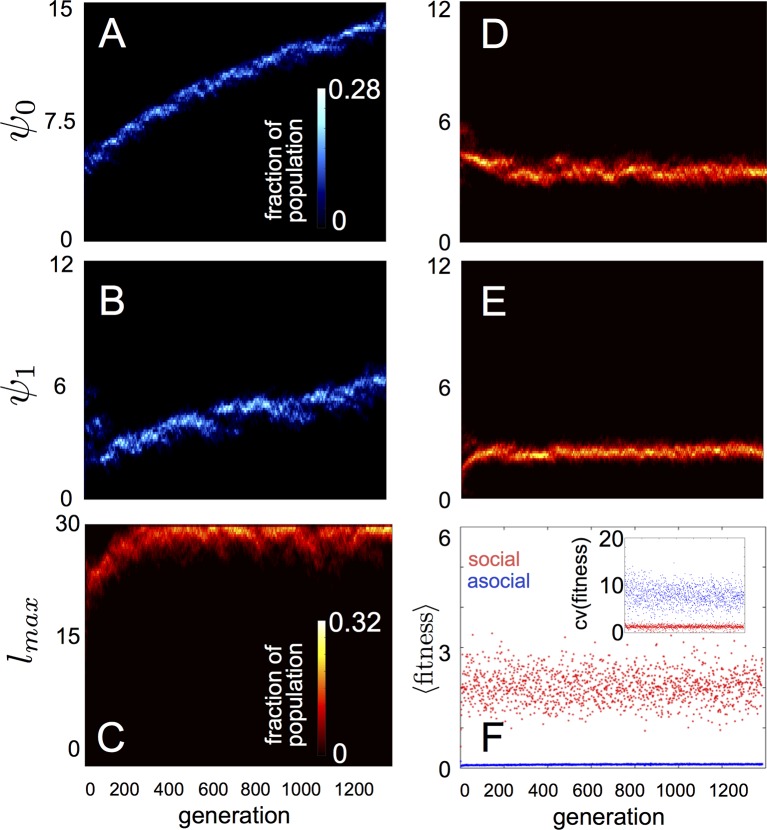
Figure 1. Evolution of behavioral rules.
(A, B) show evolutionary dynamics of populations of asocial individuals (i.e., maximum length scale of social interactions fixed; see text). (C-E) show evolutionary dynamics of individuals in which the maximum length scale of social interactions is allowed to evolve. Brightness of color indicates the frequency of a phenotype in the population. In asocial populations, baseline speed parameter (A) and environmental sensitivity (B) increase continually through evolutionary time. When is allowed to evolve (C), individuals quickly become social ( approaches maximum allowable value of 30), and baseline speed parameter (D) and environmental sensitivity (E) stabilize at intermediate values. Mean fitness of social populations (F, red points) is over five times higher than mean fitness of asocial populations (F, blue points), and the coefficient of variation in fitness is over four times lower in social populations (F inset). Unless otherwise noted, parameter values in all figures are as follows: , , , , , , , , , , , , , , and .

