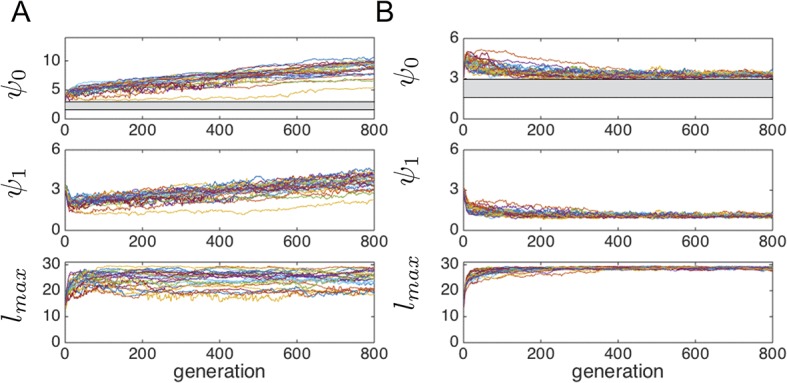
Appendix Figure 7. Evolution of behavioral traits when individuals consume resource.

Lines show means of independent evolutionary simulations. (A) High consumption rate corresponding to fast depletion of resource peaks. (B) Intermediate consumption rate corresponding to slower depletion of the peaks. Note different axis limits in the top panels of A and B. Grey region corresponds to hysteresis region between collective states shown in Main Text Figure 3. Parameters are as follows: s*=2, high consumption rate = 3.2*10–3 (time step−1), low consumption rate = 8.0*10–5 (time step−1), N = 300. All other parameters as in Figure 1 of the Main Text. These consumption rates correspond to the case where 100 individuals near the peak center can deplete a peak in roughly five time steps (fast depletion, A), and the case where the same task takes 200 time steps (slower depletion, B).
