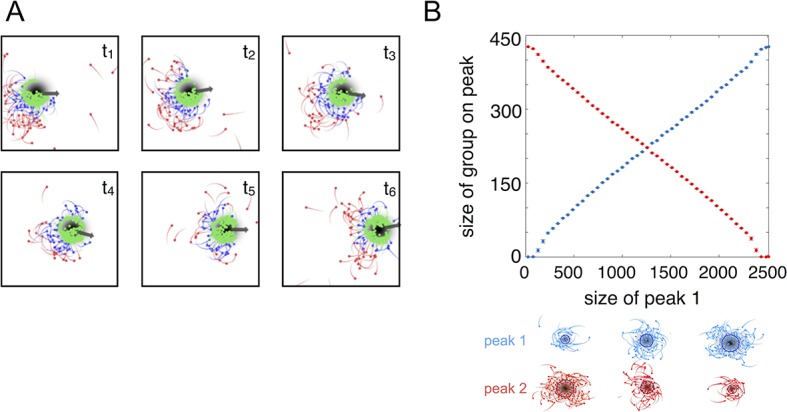
Figure 2. Collective tracking of dynamic resource and length-scale matching.

(A) Sequence (left to right, top to bottom) of individuals interacting with moving resource peak (resource value in grayscale, darker = higher resource value). Peak is drifting to the right (grey arrow). Colors indicate the regime into which each agent falls (red: , blue: , green: ). Length of tail is proportional to speed. Peak centroid moves according to 2D Brownian motion with drift (see Materials and methods). (B) When environments contain multiple resource peaks, evolved populations divide into groups that match peak sizes, e.g., in a two-peak environment, the size of group on each peak is proportional to peak size. Total size of two peaks is constant so that the larger the first peak (Peak 1, x-axis), the smaller the second peak. Peak size computed as the integral of the resource value over the entire peak (see Materials and methods). Group size is mean size of the group nearest each peak (mean taken over the last 2,500 time steps of each simulation). Points (and error bars) represent mean ( 2 standard errors) of 1,000 simulations for each combination of peak sizes. Parameters as in Figure 1 with and values of , , and taken from a population in the ESSt.
