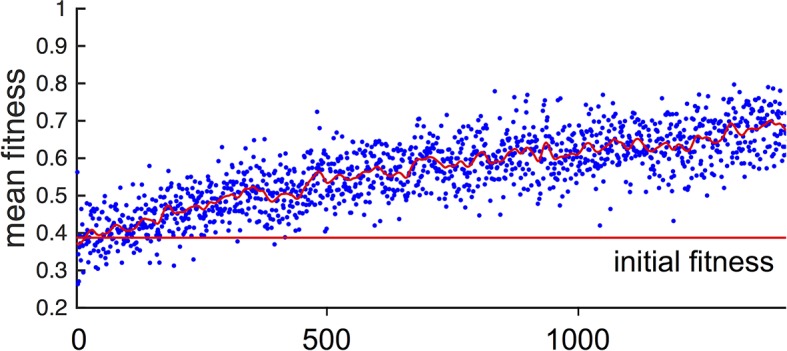
Appendix Figure 2. Fitness of asocial population through evolutionary time.

Blue points indicate mean fitness of population in each generation. Horizontal red line indicates mean fitness of population over first ten generations. Corresponding and values for each generation are shown in Figure 1A,B of the Main Text.
