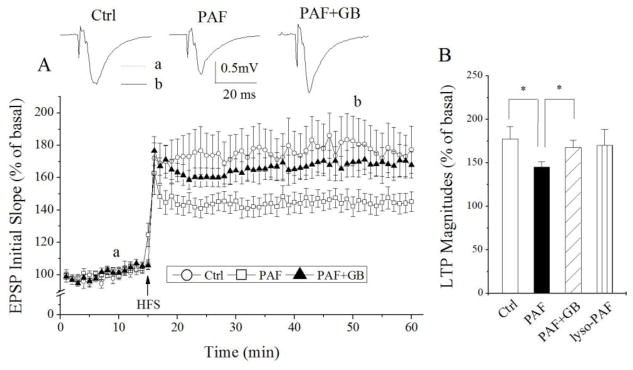
Figure 1.
PAF attenuation of LTP induced by HFS in CA1 region of rat hippocampal slices. Panel A exhibits the time course and average magnitude of LTP in the Schaffer-collateral to CA1 synapses recorded from control slices (○) and PAF-treated slices (□) and slices treated with PAF and ginkgolide B (GB), a specific PAF receptor antagonist (▲). The graph plots the initial slope of the evoked EPSPs recorded from the CA1 dendrite field (stratum radium) in response to constant current stimuli. High frequency stimulation (HFS, 100 Hz, 500ms × 2) was delivered at the time indicated by an arrow. Each data point in the graph is an average of 3 consecutive sweeps. Note that incubation of hippocampal slices with PAF significantly attenuated LTP, and such PAF-induced attenuation was blocked by PAF receptor antagonist ginkgolide B. Above the time course are representative individual field EPSPs taken from different time points marked a (dot line) and b (solid line), respectively, under different experimental conditions as indicated. The bar graph in the panel B shows the average LTP magnitudes measured at 45 min after HFS in slices of control, treated with PAF, treated with PAF plus ginkgolide B or treated with lyso-PAF, an inactive PAF analog. * denotes p<0.05.

