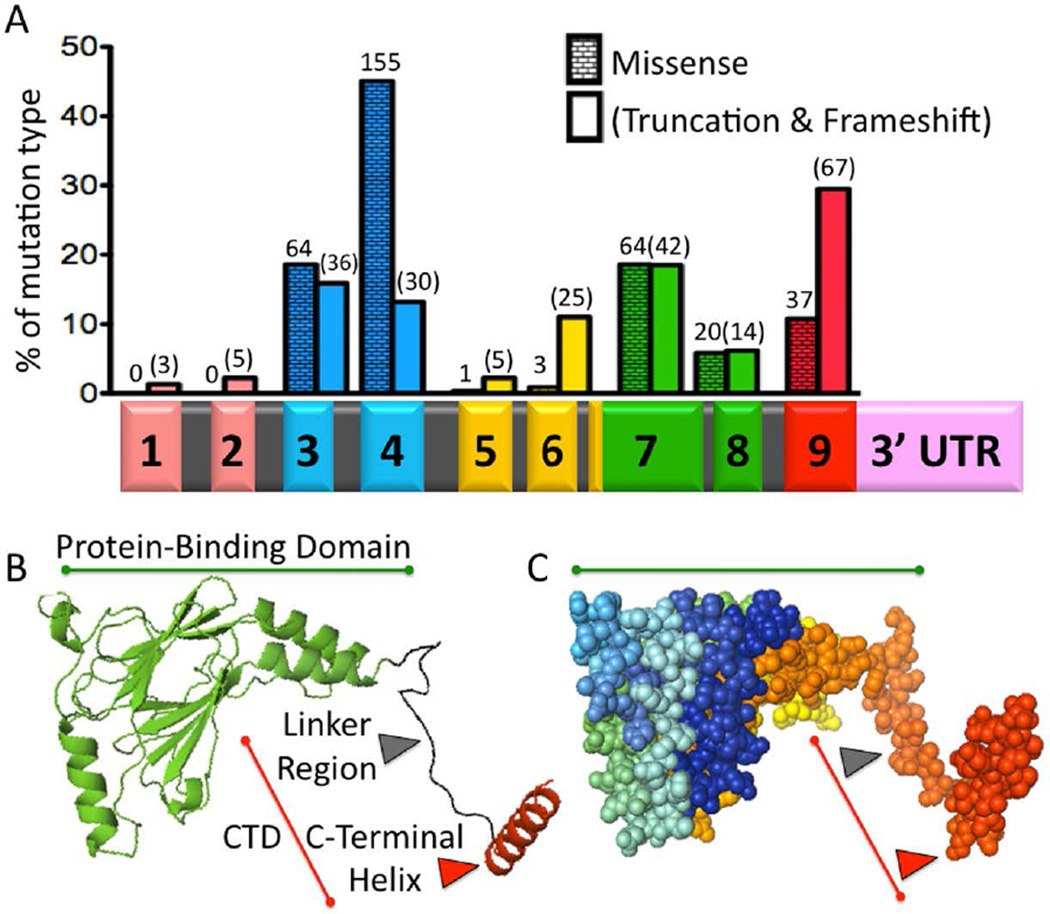
Figure 1. Syndromic Mutations and the Structure of IRF6.
A) IRF6 Mutations in VWS and PPS. Histogram showing the percent of either missense (running bond pattern) or truncation/frameshift (blank pattern) mutations contained in each exon. Number of probands is shown above each bar, for a total of 571 (Leslie et al., 2012; Leslie et al., 2015). Beneath the histogram is the IRF6 primary transcript with a bar graph color code to indicate functional protein regions. Exons 1 and 2 (peach color) constitute the 5’ Untranslated Region. Exons 3 and 4 are the DNA binding domain (blue). Exons 5 and 6 are less conserved (yellow). The majority of exon 7 and all of exon 8 are the Protein-Binding Domain (also known as the Interferon Association Domain) (green). Exon 9 contains the C-Terminal Domain (CTD) (red). The 3’Untranslated Region is also illustrated (pink). Introns are not drawn to scale. B) Protein Structure. A cartoon of IRF6 Protein-Binding Domain (PBD) (green) and C-Terminal Domain (CTD) (red), based on the structure of IRF5. The PBD consists of two beta-pleated sheets that form a central pore and are surrounded by three helices. The CTD consists of the Linker Region (black) and the C-Terminal Helix (red), which controls dimerization and activation/repression of IRF5. C) A sphere model of IRF6 in the same orientation as the cartoon model. The PBD is highlighted with a green line, while the CTD is highlighted with a red line. Different regions of the protein are highlighted using a spectrum to label the carbon backbone. Both the cartoon and sphere models were created using PyMol.

